

Chapter 3: Storage Will Eat Your Budget - Modeling Growth and Forecasting Traffic
Part 3 of 5: The Engineer's Guide to Service Cost Estimation

Parts 1 and 2 covered how to estimate the cost of a service at a point in time. But costs aren’t static — they change as data accumulates, traffic grows, and the business evolves. This part tackles the time dimension: how to model storage growth and forecast traffic so your estimates hold up over months, not just at launch.
Storage Growth Modeling
For storage-heavy services, the key challenge is modeling growth over time. I’ve seen teams estimate month-one storage costs accurately, then get blindsided six months later when the bill has tripled because nobody modeled accumulation.
The Storage Accumulation Formula
Storage at Month N = Initial Storage + (Monthly Ingest × N) - (Monthly Deletion × N)Most teams forget the deletion term, leading to runaway storage costs.
Example: Event Log System
Parameters:
Initial storage: 100GB
Daily events: 10M
Average event size: 1KB
Retention policy: 90 days
Calculation:
Daily ingest: 10M × 1KB = 10GB/day
Monthly ingest: 10GB × 30 = 300GB/month
Steady-state storage: 10GB × 90 days = 900GB
After 90 days, storage stabilizes at ~900GB because old data ages out as fast as new data comes in.
Monthly cost at steady state:
S3 storage: 900GB × $0.023 = $20.70
S3 requests (writes): 300M × $0.005/1K = $1,500
S3 requests (reads): 100M × $0.0004/1K = $40
Total: ~$1,560/month
Notice that the request cost ($1,540) dwarfs the storage cost ($20.70). This is a common pattern — the cost of accessing data often exceeds the cost of storing it. Engineers who only model storage volume miss the dominant cost driver.
The Retention Policy Lever
Retention is your biggest cost lever for storage systems:
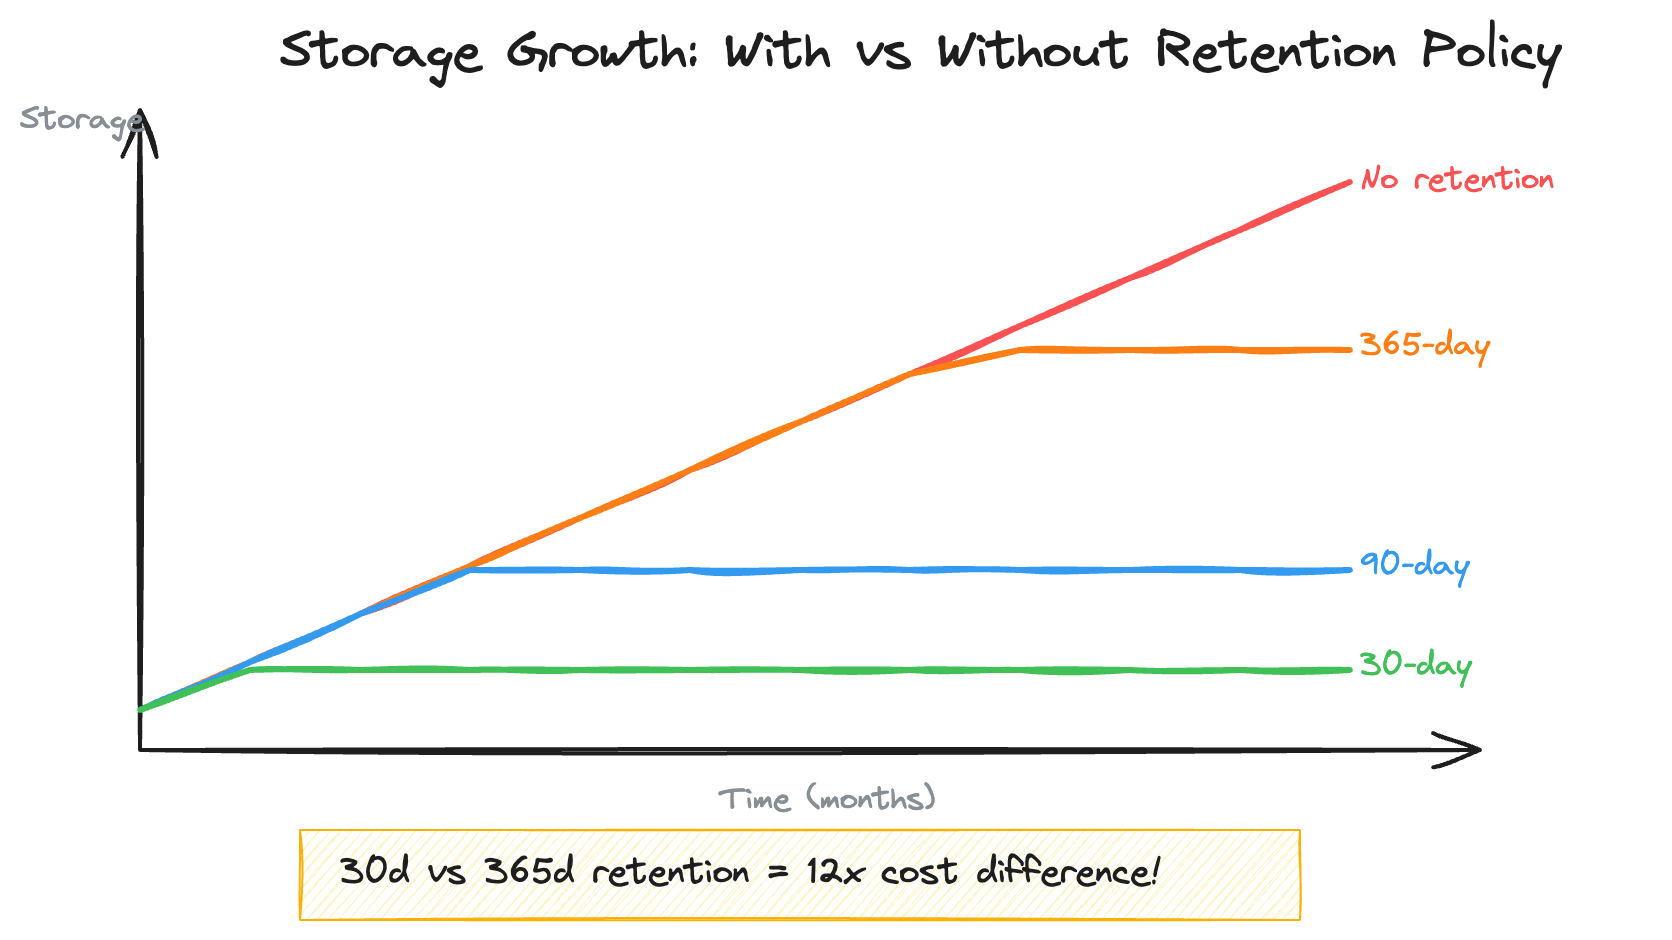
A single decision about retention — 30 days vs. 365 days — is a 12x cost difference. Always define retention policies before launch. “We’ll figure it out later” is how you end up with $50K/month log storage bills.
Storage Modeling at Scale
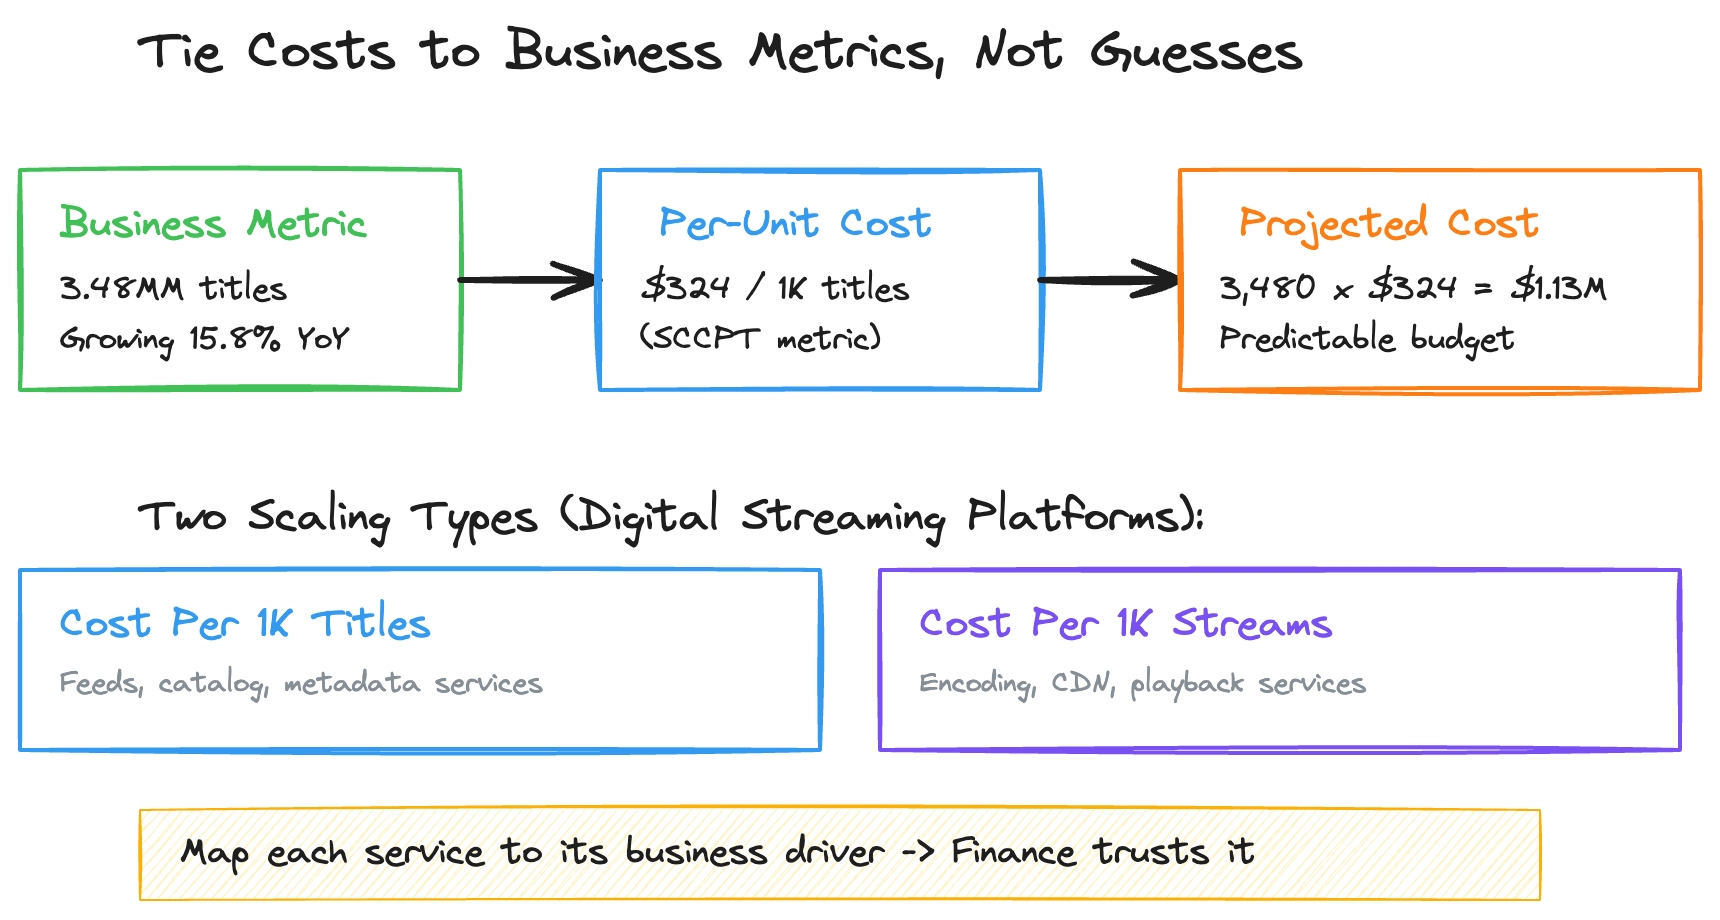
These dynamics play out dramatically at large catalog scales. In Prime Video storage-driven costs scaled with the catalog — 3.48MM titles, each requiring metadata, cross-region replicas, and feed generation artifacts. The cost per unit metric captured this: $324 per 1K titles in 2019, with $202 of that going to cross-region data transfer for maintaining synchronized catalog snapshots across AWS regions.
But the storage model wasn’t static. The catalog was projected to grow 16% year-over-year. Additionally, as part a platform unification effort — required running parallel catalog generation pipelines during the transition. This meant cost per unit would temporarily spike by 1.5x, not because of inefficiency, but because the old and new systems had to coexist until A/B testing validated the migration to ensure zero regression.
Modeling that explicitly — “here’s the baseline growth trajectory, here’s the migration overlap period, here’s when it converges” — was the difference between a cost increase that looked alarming and one that was planned and bounded. Without the model, a 50% cost spike triggers escalations. With the model, it triggers a review to confirm you’re tracking to the plan.
Traffic Forecasting for Budgeting
Estimating costs requires estimating traffic. Here’s how to do it without making up numbers.
Method 1: Historical Growth Rate
If you have historical data, project it forward:
Current traffic: 100M requests/month
12-month growth rate: 8% month-over-month

Month 6 forecast: 100M × (1.08)^6 = 159M
Month 12 forecast: 100M × (1.08)^12 = 252M
This is simple but dangerous — it assumes the growth rate stays constant. Fine for 3–6 month projections, unreliable beyond that.
Method 2: Business Driver Correlation
Tie traffic to business metrics you can forecast:
Relationship: 1 order = 15 API calls
Business forecast: 2M orders/month → 3M orders/month (next year)
Traffic forecast: 30M → 45M requests/month
This is the more reliable method because it connects to business planning rather than extrapolating technical metrics in isolation. Your finance team already forecasts orders, subscribers, or titles — piggyback on their projections.
At Prime Video, the entire cost framework was anchored to two business metrics: number of titles (which drove storage-related fleets) and number of streams (which drove compute-related fleets). A core cross-functional team identified which of the 18+ services across the organization scaled by titles versus streams. This mapping — seemingly simple — was the structural insight that made the whole cost model work.
For example, the Digital Catalog scaled with titles. So when the business forecast projected title growth from 3.48MM to a higher number in the following year, every team could immediately calculate their projected cost: current cost per unit × projected title count = projected spend. No guessing, no gut-feel estimates. The business inputs drove the infrastructure math.
Method 3: Capacity Planning Tiers
For budgeting, forecast three scenarios:
Budget for Base, alert at High, and don’t panic at Low.
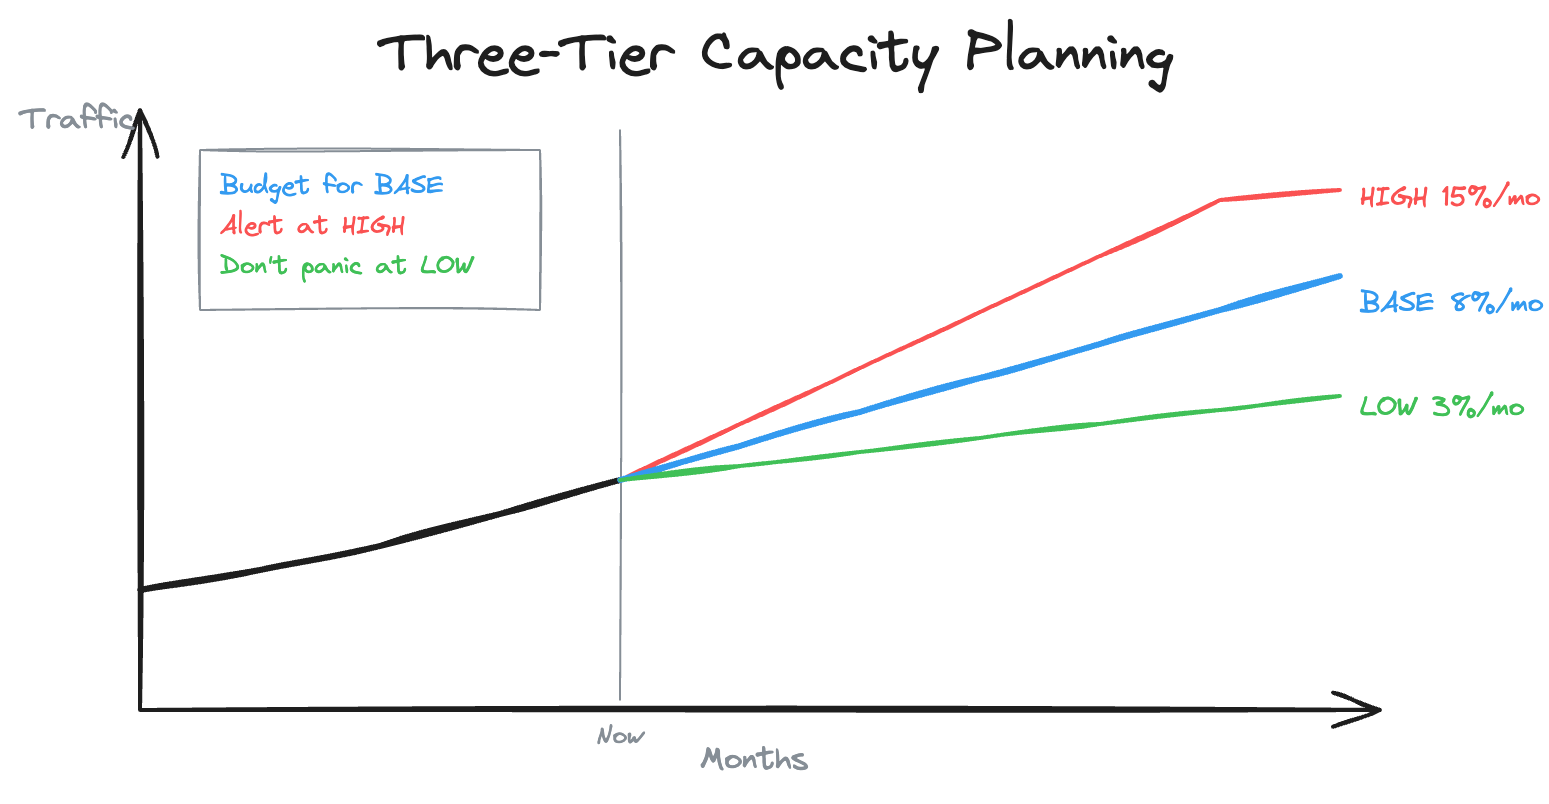
This three-tier approach is especially important when new features or programs will shift your cost trajectory. Consider how cost steps work in practice: Lambda costs scale continuously, but EC2-based services have step functions — you pay for a fixed instance until you need to add another. A good forecast identifies where those step boundaries are so you aren’t surprised when traffic crosses a threshold.
Connecting Storage and Traffic Models
In practice, storage and traffic interact. More traffic generates more logs, which grow storage. More stored data means more to replicate cross-region, which increases transfer costs. The best estimates model both dimensions together.
Here’s how I think about it:
Month 1:
  Traffic: 50M requests → Compute cost: $500
  Storage: 100GB → Storage cost: $50
  Total: $550

Month 6:
  Traffic: 89M requests → Compute cost: $890
  Storage: 400GB (accumulated) → Storage cost: $200
  Total: $1,090

Month 12:
  Traffic: 157M requests → Compute cost: $1,570
  Storage: 700GB (approaching steady state) → Storage cost: $350
  Total: $1,920
The ratio shifts over time. At launch, compute dominates. After a year, storage has crept up. Without modeling both, your month-12 estimate will be off by 30%+.
There’s a subtler version of this interaction that’s worth internalizing: as catalog or dataset size grows, the cost of processing that data also grows — even if traffic stays flat. For example, a large data processing platform operating on massive catalogs or datasets will naturally take longer and consume more resources as the underlying data expands. In many cases, the per-item compute cost can remain relatively stable, yet the absolute compute bill still increases simply because there is more data to process. Only by tracking cost per unit can you distinguish between cost growth driven by healthy data expansion (acceptable) and cost growth caused by declining efficiency (a problem that needs fixing).
The Takeaway
Storage grows silently. Traffic grows visibly. Both need explicit models with time dimensions. The frameworks in this part — storage accumulation with retention policies, traffic forecasting tied to business drivers, and three-tier capacity planning — give you the tools to project costs forward rather than just snapshot them.
The single most impactful thing you can do is identify the business metric your service scales against, then tie your cost model directly to it. If you can say “our cost per unit is $X, the business expects Y units next year, so our projected spend is $Z” — you have a cost model that finance trusts, leadership can act on, and your team can be held accountable to.
In Part 4, I’ll shift from estimation to operation: the monitoring stack you need to catch when reality diverges from your estimates, the most common mistakes that blow budgets, and a practical checklist to run before committing to any budget.
Nikhil Chandra is a Engineering Manager with 11+ years of experience building high-scale e-commerce and streaming systems. He writes about engineering leadership and cloud architecture at codetofire.com. Connect on LinkedIn.
Tags: #cloud #aws #costoptimization #engineering #finops #systemdesign