

Chapter 5: Real-World Cloud Cost Breakdowns - Cloud bills are just code you haven’t optimized yet.
Part 5 of 5: The Engineer's Guide to Service Cost Estimation

Theory is useful. Production data is convincing. In this final installment, I’m sharing three real-world cost breakdowns from systems I’ve built and operated — each illustrating different cost patterns, different optimization strategies, and different lessons for how to think about cloud economics at scale.
Case Study 1: Prime Video’s Catalog Feed Generation Platform
The Architecture and Its Cost Structure
A global digital streaming service distributes content to 200+ countries through dozens of external platform partners, including smart TV manufacturers, device ecosystems, and telecom distribution platforms. Each partner requires structured catalog feeds containing metadata, availability windows, pricing, and localized content descriptions in multiple formats and languages. A centralized video supply chain organization manages this infrastructure, and the catalog feed generation system was the specific component I analyzed and optimized.
The architecture worked as follows: the service’s canonical catalog data store maintained distributed database projections across multiple cloud regions. Processing clusters in each region read from the local database replicas, transformed catalog metadata, and wrote consolidated snapshots to centralized object storage in a primary region. From there, the system generated partner-specific feeds — each requiring different schemas, mappings, and content filters — for every combination of feed type and marketplace. Each feed-marketplace combination ran as an independent processing job to support customization and scaling needs.
Monthly bill: approximately $400K.
Decomposing the Bill
When I first pulled the cost breakdown from AWS Cost Explorer, the top-level categories were misleading:
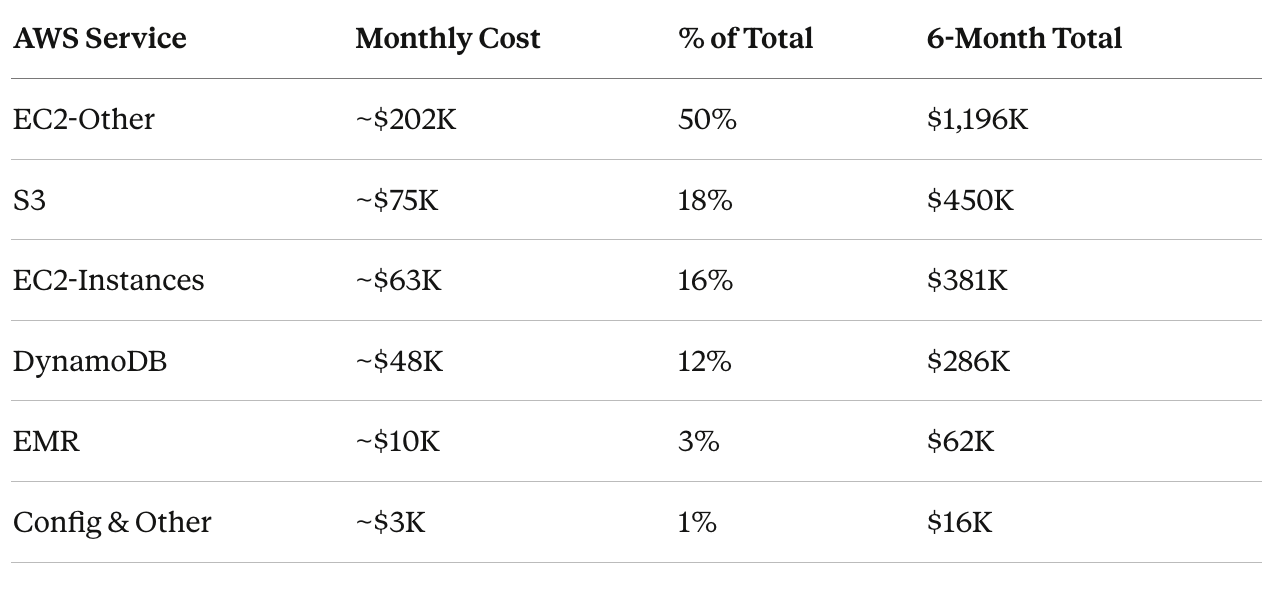
“EC2-Other” sounds like it should be compute-adjacent. It wasn’t. Decomposing by usage type told the real story.
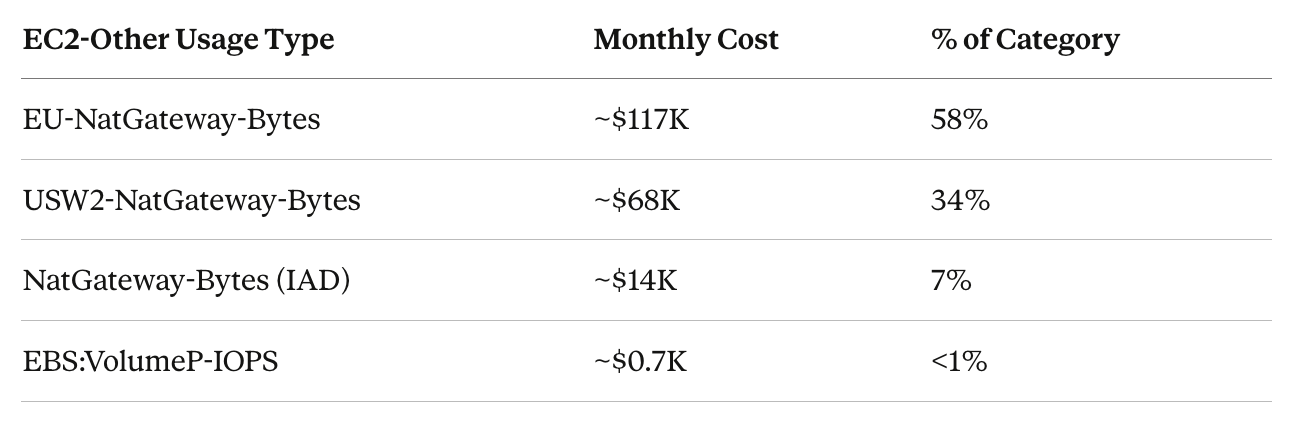
The $200K “EC2” bill was overwhelmingly NAT Gateway data transfer — the cost of moving catalog snapshots across regions through NAT Gateways. Actual EBS costs were negligible.
The S3 pattern was identical:
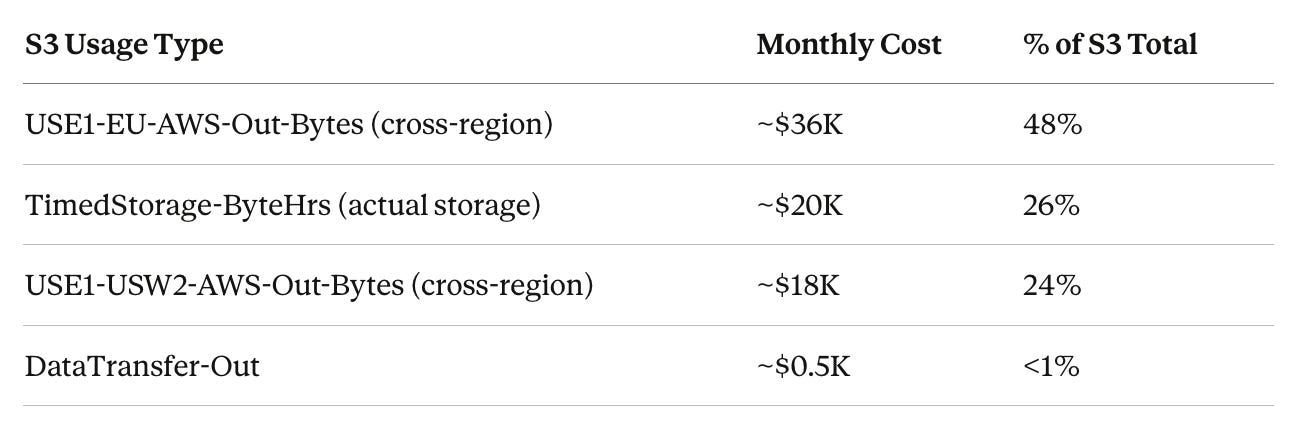
75% of S3 costs were cross-region data transfer. Storage itself — the thing S3 is named for — was 26%.
The Root Cause: Full-Snapshot Architecture
The architectural limitation driving these costs was straightforward: the feed generation system could not operate on incremental updates. Each execution required a full catalog export from every region, with the complete dataset transferred to a central region for processing. For a catalog containing millions of titles, that meant moving the entire dataset on every run — even though only a small fraction of entries typically changed between runs.
This approach made sense when the system was originally designed at a much smaller scale. But as the catalog expanded, costs grew linearly with total catalog size rather than with actual change volume. In other words, infrastructure spend scaled with data footprint, not with meaningful updates.
Per-unit cost metrics made the inefficiency visible. The cost per thousand titles revealed that a majority of the per-title processing expense — over 60% in this case — was driven by cross-region data transfer rather than compute or transformation work. Without that decomposition, the dominant cost driver would have remained obscured inside aggregate infrastructure spend.
Two Optimizations, $1.74M in Annual Savings
Optimization 1: Incremental Data Transfer.
As part of a broader evolution of the feed generation architecture, the system was redesigned to operate on incremental catalog changes rather than full snapshots. Instead of copying entire database tables across regions during every processing cycle, only the delta — titles that had been added, modified, or removed since the previous run — was transferred. In a catalog where daily change rates represented only a small fraction of total size, this dramatically reduced data transfer volume and associated costs.
Projected impact: roughly a 50% reduction in per-stream supply chain cost, saving approximately $1.2M annually.
Optimization 2: Eliminate Duplicate Storage.
The system previously maintained catalog data across two storage layers — a distributed database used for projections and object storage used for feed generation. By evolving the architecture to rely on object storage as the primary processing source, the system eliminated the need to maintain redundant projections, removing a significant portion of provisioned capacity costs.
Projected impact: approximately a 10% reduction in per-stream supply chain cost, saving $540K annually.
Combined impact: these changes reduced per-unit supply chain cost by roughly 60%, lowering projected monthly infrastructure spend from approximately $400K to about $250K, while maintaining the same catalog and partner delivery capabilities.
The Broader Platform Transformation
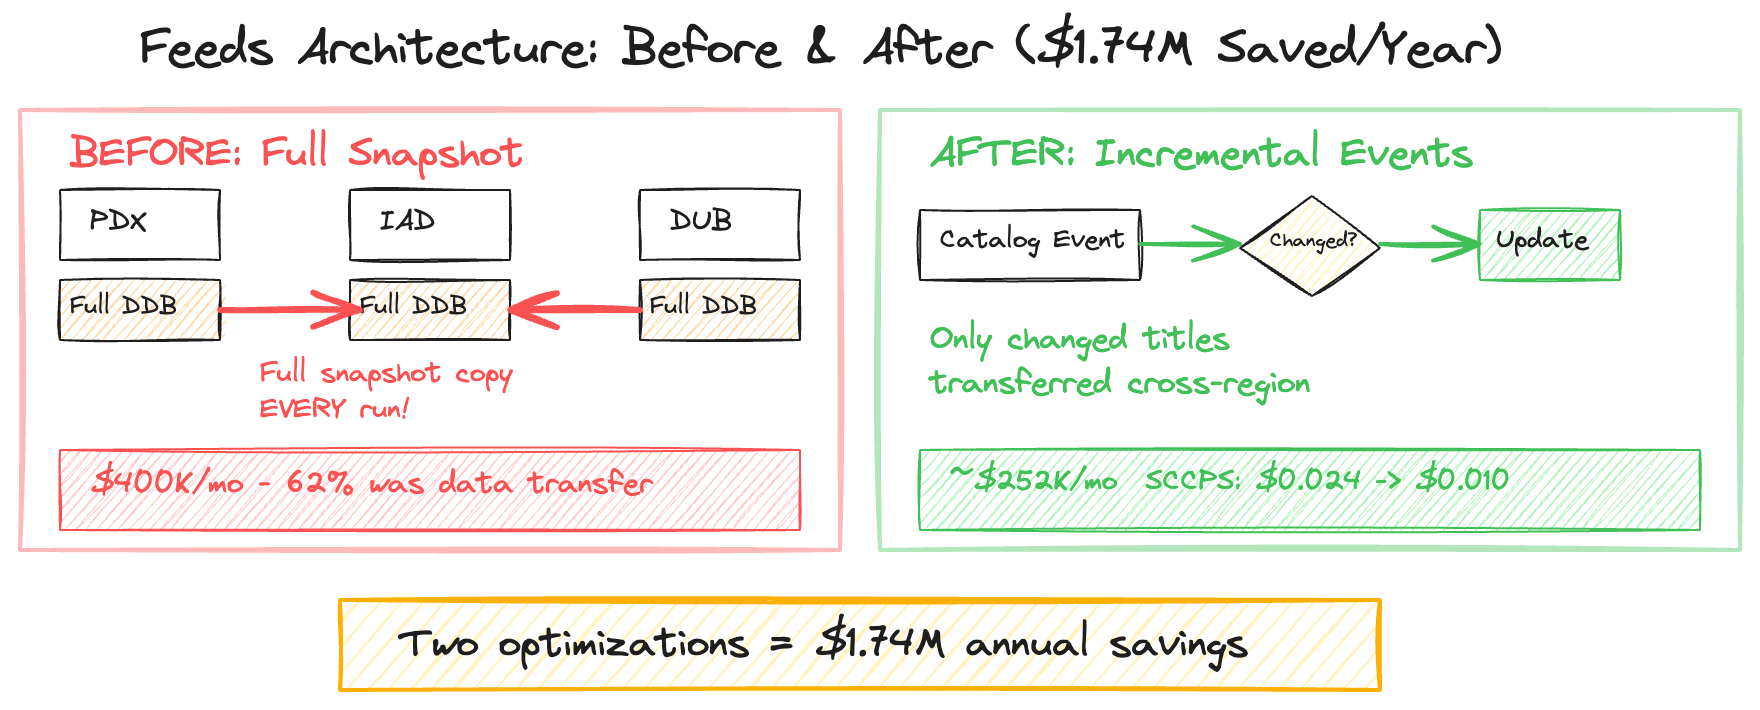
The cost optimization was part of a larger architectural shift from batch-oriented feed generation to a notification-based, event-driven platform. The legacy system ran scheduled jobs; the new platform propagated catalog changes as events, triggering feed updates only when data actually changed.
The per-unit cost framework made the business case quantifiable. Without per-unit metrics, the argument for redesigning a system that was already functioning would have remained largely qualitative. With clear cost-per-unit measurements in place, the projected $1.74M in annual savings became concrete and trackable. The migration plan also explicitly accounted for the temporary cost increase during the period when both old and new systems operated in parallel, ensuring leadership expectations were aligned and avoiding surprises during the transition.
Case Study 2: Cart Progress Bar System — $86/Month, $900M+ Impact
This case study is the inverse of the feeds system: instead of optimizing a high-cost platform, it demonstrates how a well-designed serverless architecture keeps costs almost irrelevant while the business impact scales independently.
The System
The Progressive Cart Incentive Platform shows customers their real-time progress toward free shipping thresholds as they add items to their cart. It processes millions of cart updates monthly, performing real-time price and shipping calculations to render a progress indicator. The design I implemented used behavioral economics principles — variable reward thresholds, dynamic messaging — to influence purchasing behavior.
Why This Architecture Works Economically
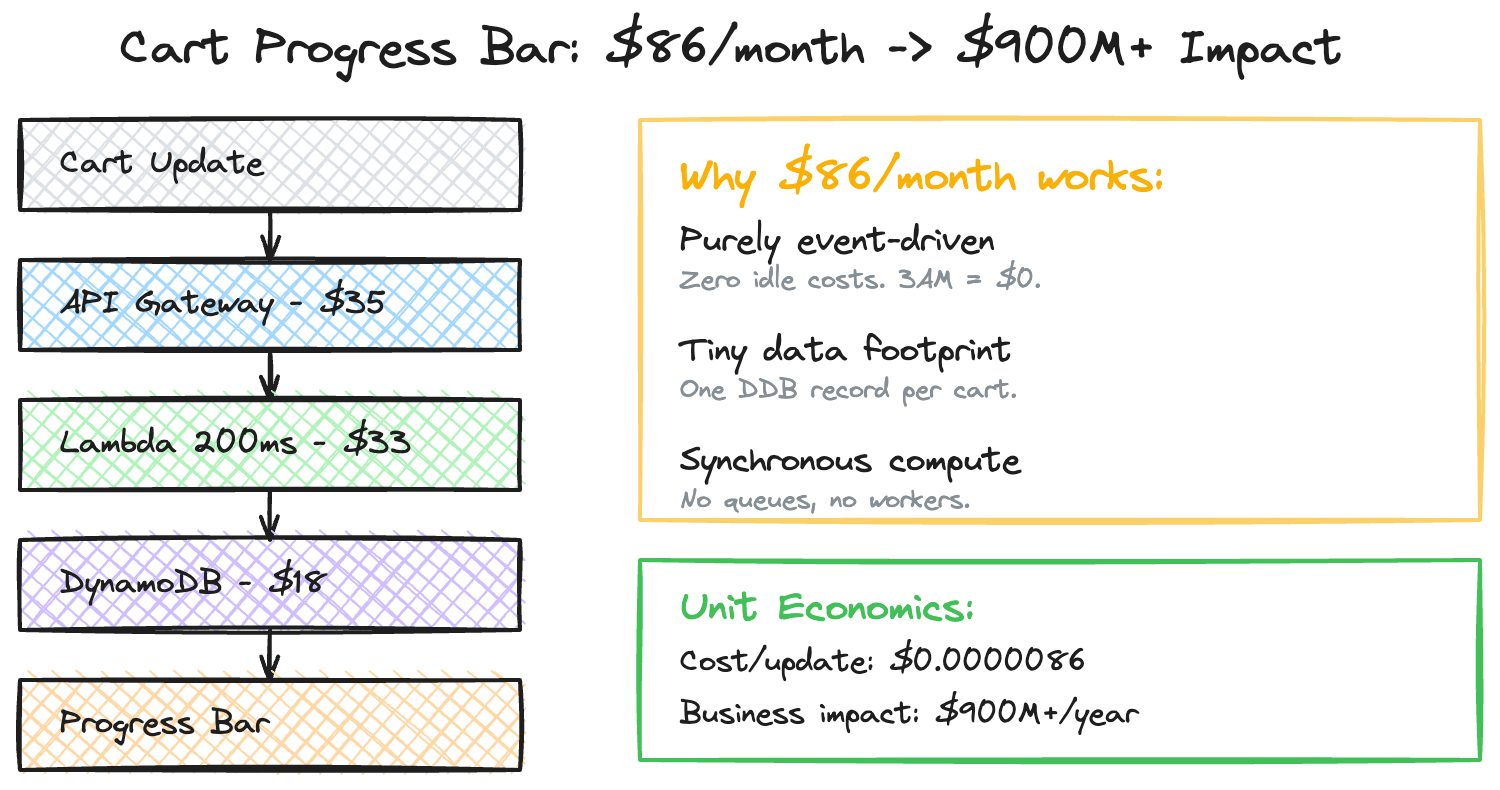
Three architectural decisions kept costs minimal:
Purely event-driven. Lambda and DynamoDB on-demand mean zero idle costs. At 3 AM when cart activity drops to near zero, the bill drops proportionally. There’s no EC2 fleet running at 5% utilization overnight.
Minimal data footprint. Each cart calculation requires reading the current cart state (small DynamoDB record) and the applicable threshold configuration. No large datasets, no cross-region replication, no batch processing.
Computation at the edge of the request. The progress calculation happens synchronously within the cart update request — there’s no separate processing pipeline, no queue, no asynchronous worker fleet. One request in, one response out, one DynamoDB write for state.
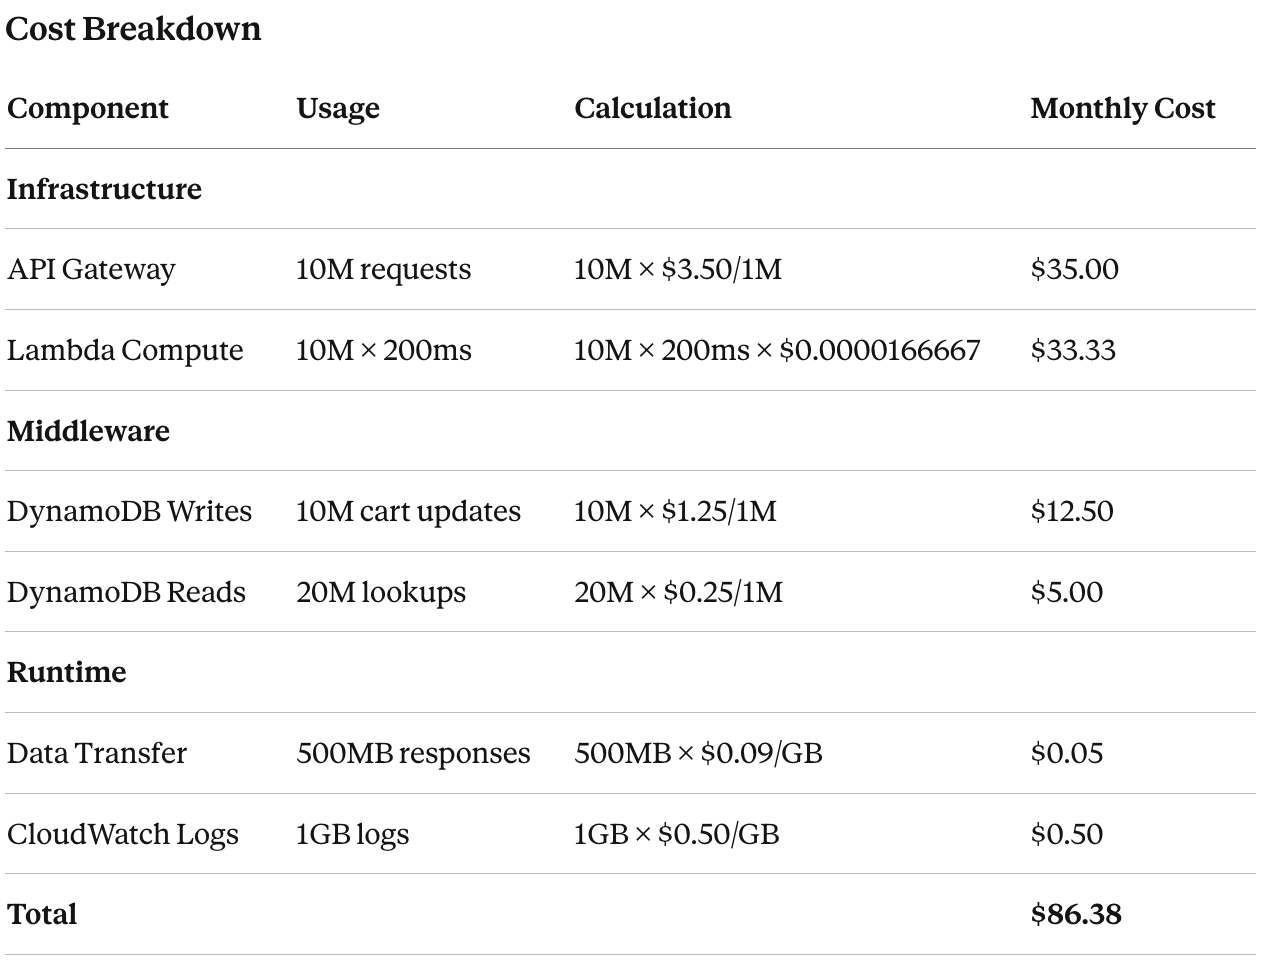
The Unit Economics
Cost Per Cart Update: $86.38 ÷ 10M = $0.0000086
Business Impact: $900,000,000+ annually
Cost/Revenue Ratio: 0.0000096%
This is the kind of system where the ROI conversation is almost absurd — the infrastructure is a rounding error against the business value. But the cost estimation frameworks still matter here. If you’d designed this system with provisioned EC2 instances, an SQS queue for async processing, and a separate DynamoDB table with provisioned capacity, the same functionality would cost 10–50x more. The architecture is the cost optimization.
The impact of this approach extended beyond Amazon. Within 30 months of launch, competitors including Instacart, DoorDash, and other major e-commerce platforms implemented similar progressive cart incentive patterns — suggesting the underlying design had broader industry relevance.
Case Study 3: Ultra-Fast Delivery Cost Modeling
Ultra-fast delivery systems are a different beast entirely. They blend physical logistics with technology infrastructure, creating a cost model where cloud spend is actually the smaller component.
Multi-Modal Cost Drivers
Unlike traditional software services, delivery systems have physical infrastructure (fulfillment centers, vehicles), technology infrastructure (routing, tracking, optimization), human resources (drivers, warehouse staff), and variable density (urban vs suburban vs rural costs). The cost estimation frameworks from Parts 2 and 3 apply to the technology layer, but the physical layer introduces fixed costs and density effects that change the optimization calculus.
The Critical Mass Effect
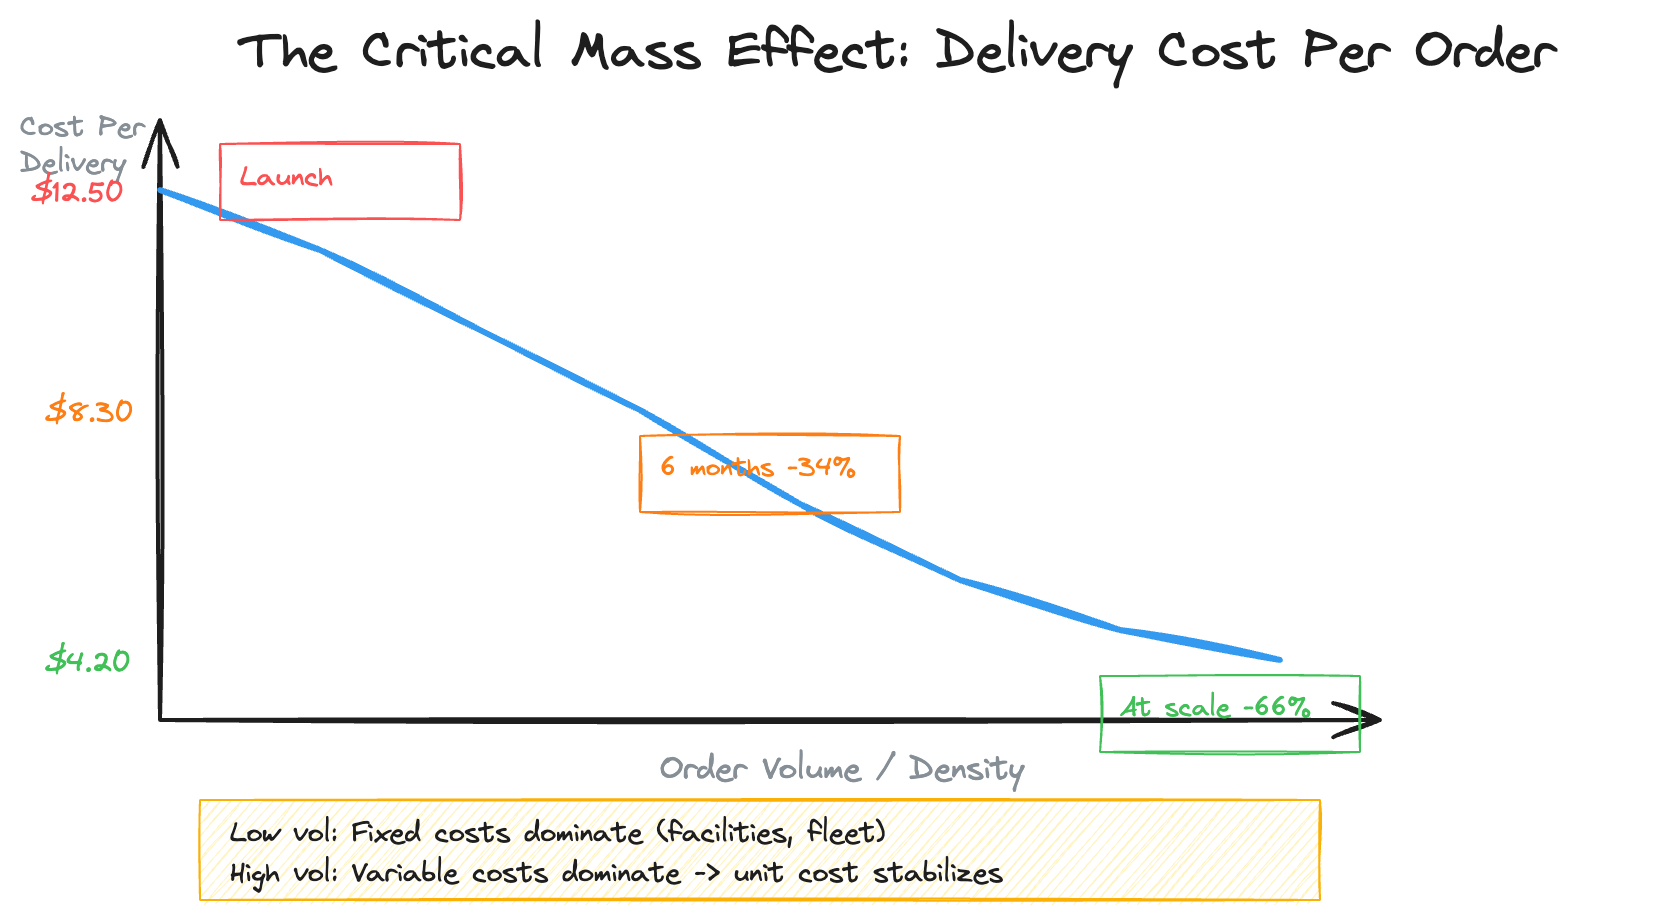
The most important cost dynamic in delivery systems is the critical mass effect: fixed infrastructure costs (fulfillment centers, vehicles, technology platform) drop dramatically per delivery as volume increases, while variable costs (driver time, fuel) remain roughly linear.
That 66% improvement wasn’t from technology optimization alone. It came from density — more deliveries per geographic area, more orders per driver-hour, better utilization of fixed infrastructure. The technology layer enabled this through route optimization algorithms that improved delivery density by 40%, reducing average delivery time by 15%.
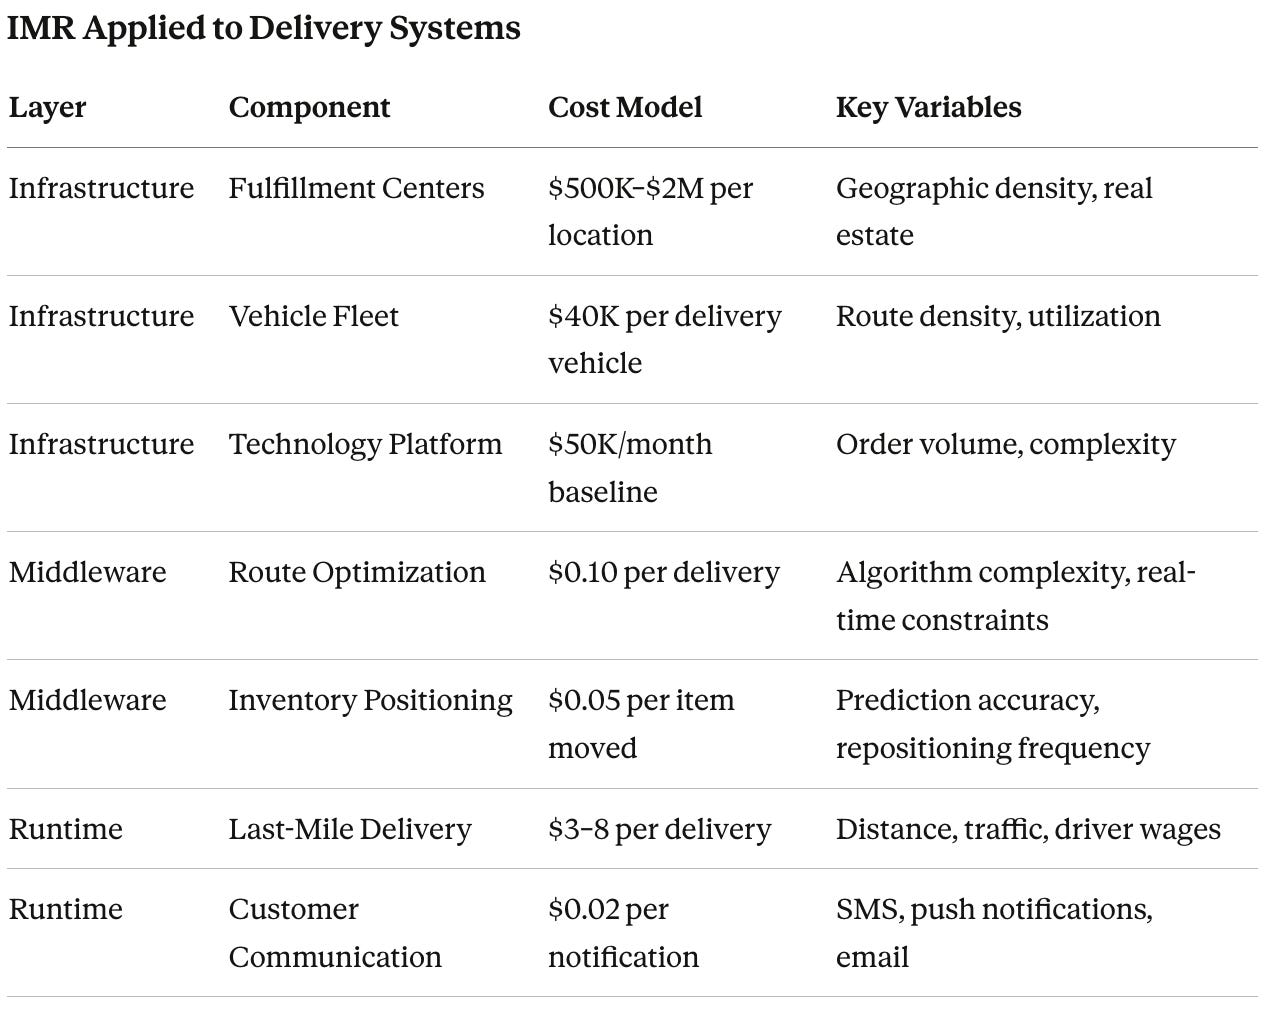
Storage vs. Throughput in Delivery
Storage-Driven Costs (Geographic Infrastructure): Fulfillment center leases (per sq ft/year), vehicle fleet (per vehicle/month), and inventory holding (per item/day). These exist whether you deliver zero packages or a thousand.
Throughput-Driven Costs (Per-Delivery Operations): Driver wages ($15–25/hour), fuel/maintenance ($0.56/mile), route optimization ($0.10/delivery), and customer notifications ($0.02/order). These scale linearly with volume.
The key insight for cost estimation: at low volume, storage-driven costs dominate (you’re paying for fulfillment centers and vehicles regardless of utilization). At high volume, throughput-driven costs dominate (every incremental delivery’s marginal cost is mostly driver time and fuel).
The crossover point — where per-delivery cost stabilizes — is your breakeven density. Identifying that threshold early is critical for geographic expansion decisions.
For the infrastructure I built, the technology platform maintained 99.9% uptime during peak demand while supporting sub-same-day delivery windows. The inventory positioning algorithms reduced fulfillment costs by 23% by predicting demand patterns and pre-positioning stock closer to likely delivery zones.
Tying It All Together: Lessons Across Three Systems
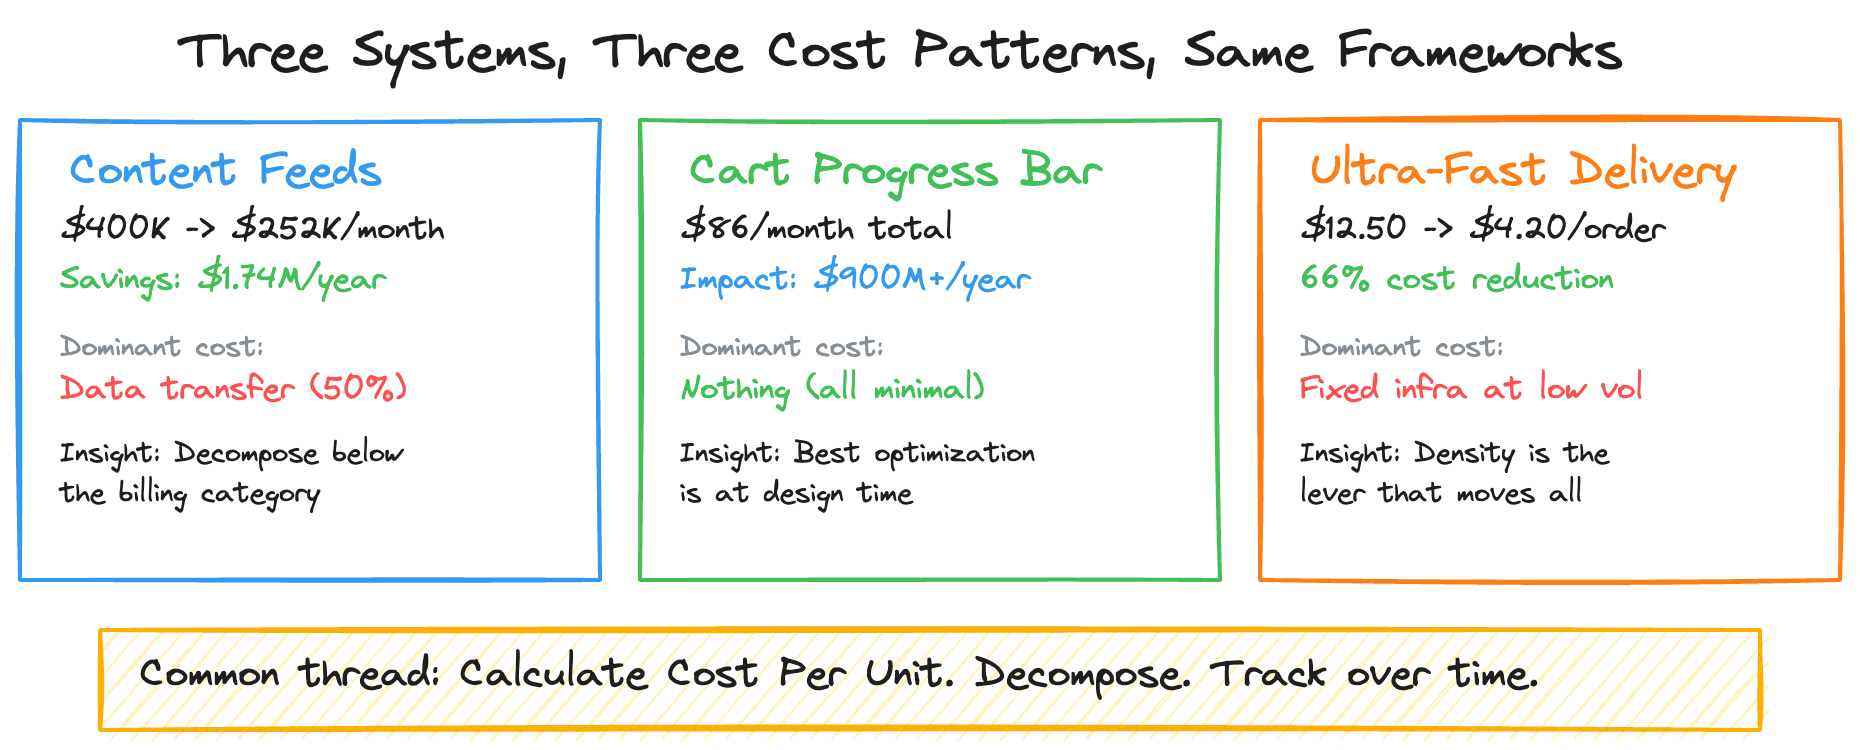
Each case study illustrates a different cost pattern, but the same estimation principles apply:
The feeds system was dominated by data transfer (50% of spend), hidden inside misleading billing categories. The optimization strategy targeted the architectural root cause — full-snapshot replication — not the symptom. Per-unit metrics made the $1.74M savings opportunity visible and trackable.
The cart system was dominated by nothing — every component was cheap because the architecture eliminated idle costs, minimized data movement, and kept computation synchronous. The lesson isn’t “use serverless” — it’s that the most impactful cost optimization happens at design time, not after the bill arrives.
The delivery system demonstrated the critical mass effect: fixed costs that seem overwhelming at low volume become negligible at scale, while variable costs remain linear. Estimating delivery economics requires modeling density, not just traffic.
The Principles That Hold Across All Three
Every cost is either storage-driven or throughput-driven. Understand which dominates. It’s rarely what you assume.
Calculate Cost Per Unit. $400K/month sounds alarming. $0.024 per 1K streams for a system serving 200+ countries sounds reasonable. Same bill, different framing, completely different conversation.
Decompose below the billing category. EC2-Other isn’t compute. S3 isn’t storage. The real cost driver is often two levels down from what the dashboard shows.
Model the time dimension. Month-one costs aren’t month-twelve costs. Storage accumulates, migrations create temporary spikes, and density effects change unit economics over time.
Find your dominant cost driver. In the feeds system, two optimizations targeting 60% of spend delivered $1.74M in savings. In the cart system, the dominant cost driver was... nothing, because the architecture was designed with cost as a constraint. In delivery, density was the lever that moved everything.
Build the bridge. When costs change, categorize why. The explanation isn’t bureaucracy — it’s the mechanism that turns cost data into engineering decisions.
The best engineers I’ve worked with think about cost as a feature requirement, not an afterthought. They estimate before building, monitor during operation, and optimize continuously. Every system in this series was built with that mindset.
This concludes the 5-part series on Service Cost Estimation. If you found it valuable, share it with your engineering team — especially the ones who just got a surprise cloud bill.
Tags: #cloud #aws #costoptimization #engineering #finops #systemdesign #architecture