

Chapter 4: The Cost Monitoring Playbook - Catching Problems Before They Hit Your Budget
Part 4 of 5: The Engineer's Guide to Service Cost Estimation

Estimation without monitoring is guessing twice — once when you plan, and again when you can’t explain why the bill is 40% higher than expected. This part covers the operational side: the monitoring stack every service needs, the cost accountability model that keeps teams honest, the mistakes that blow up even good estimates, and a comprehensive checklist to run before committing budget.
The Cost Monitoring Stack
Here’s the minimum viable cost monitoring setup every service should have from day one.
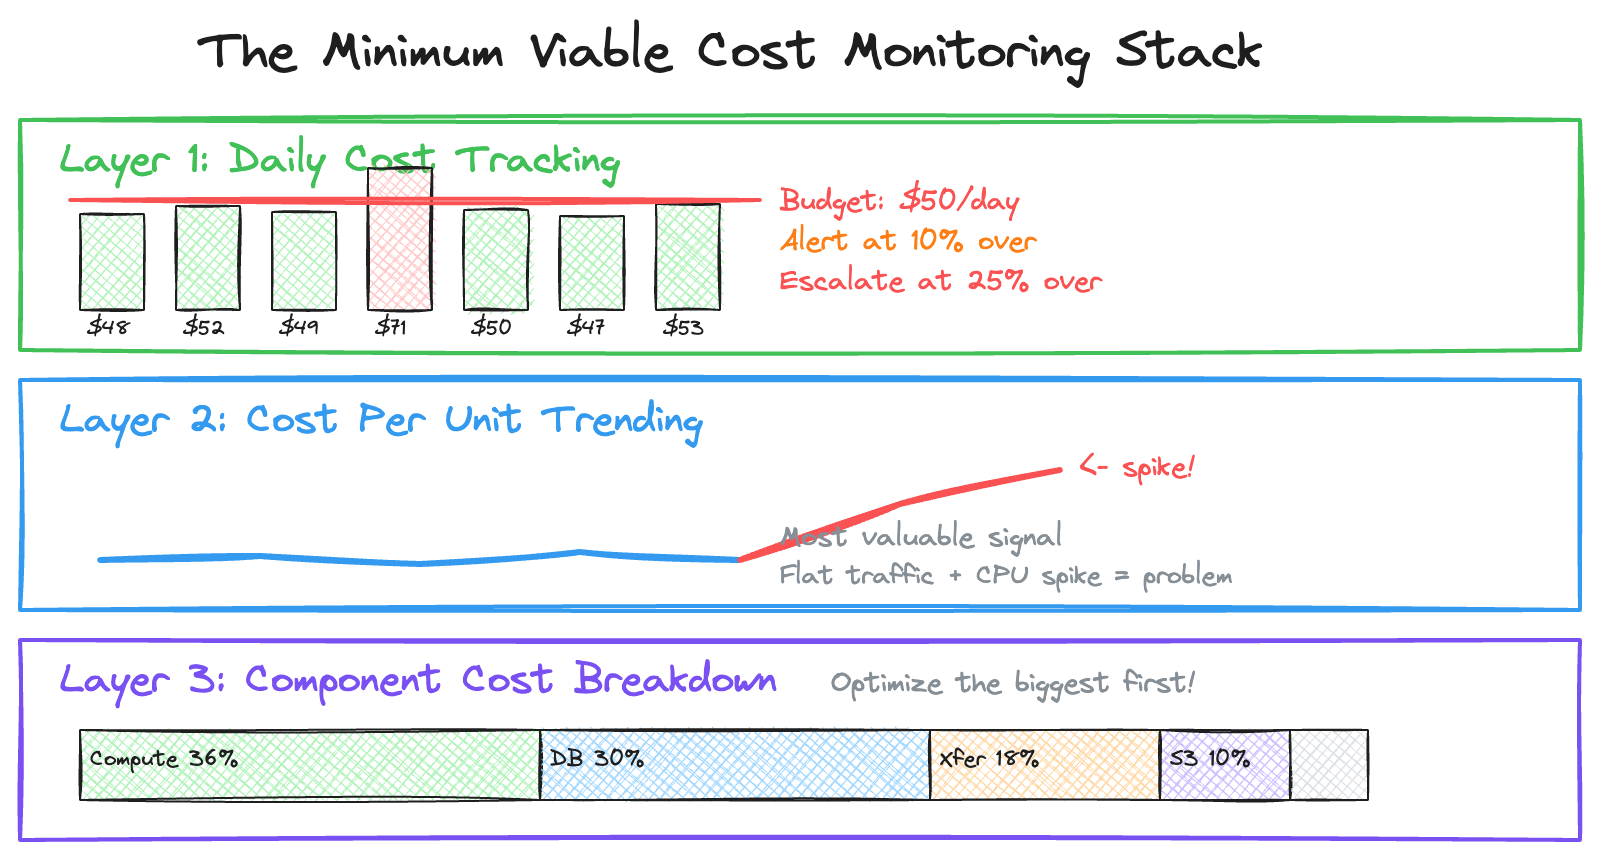
Daily Cost Tracking
Track daily spend and compare to budget. Catch anomalies early. A 40% daily spike is easier to investigate than a 40% monthly surprise. Set your alert threshold at 10% over daily budget and your escalation threshold at 25% over.
Cost Per Unit Trending
This is the most valuable signal in your monitoring stack. Track your Cost Per Unit over time. If Cost Per Unit spikes while traffic is flat, you have an efficiency problem — a code change introduced more database calls, a cache stopped working, or a logging change increased volume. This is the metric that separates teams who react to cost problems from teams who prevent them.
Component Cost Breakdown
Know where your money goes. This tells you where to focus optimization efforts. Cutting compute by 20% saves $360. Cutting “Other” by 20% saves $60. Always optimize the largest component first.
The Bridge Methodology: Making Cost Accountability Work
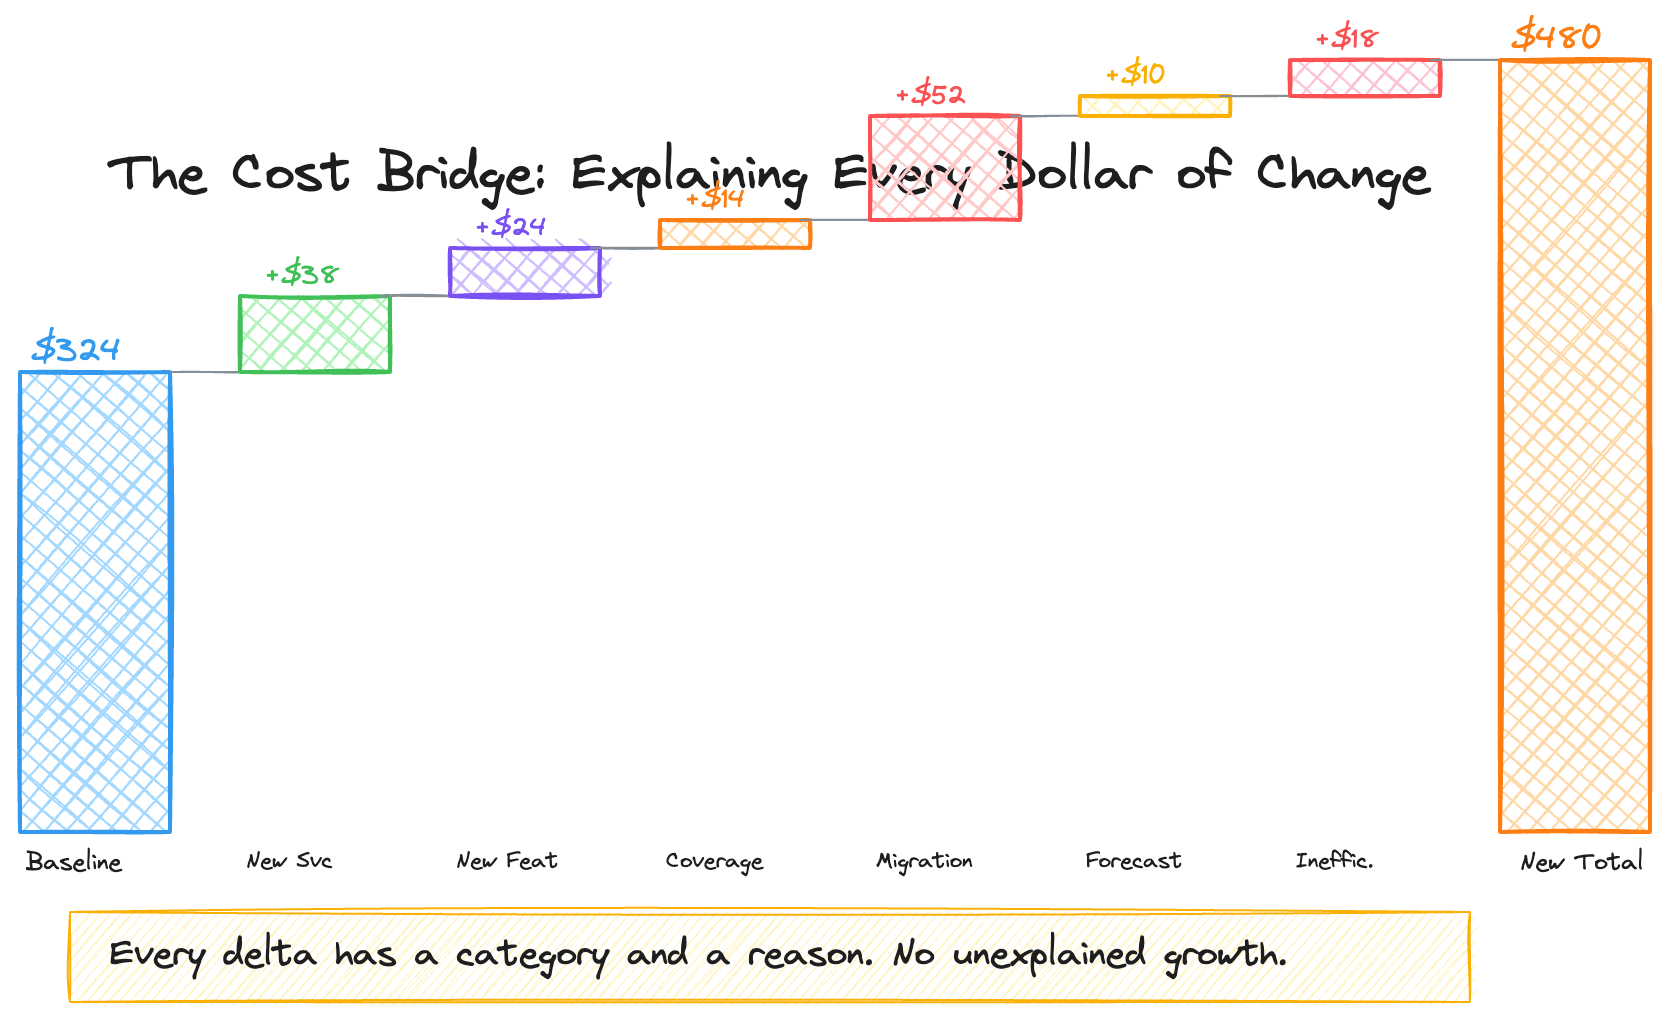
Monitoring tells you what changed. The bridge methodology tells you why.
When costs escalate faster than your business metric, someone needs to explain the gap. Not as punishment — as engineering rigor. The best cost cultures I’ve worked in required teams to categorize every cost delta into one of these buckets:
1. New Service Launch. A new component went live. You can quantify the per-unit cost it adds and when it’s expected to reach steady state. Example: “New policy validation service launched in Q3, adding $0.003 to cost per unit. Expected to stabilize by Q1 next year.”
2. New Feature in Existing Service. An existing service grew in scope. Example: “Added multi-language metadata enrichment, adding $0.001 per title for 12 additional language variants.”
3. Extended Coverage. Your service now processes more of the catalog or handles more edge cases. Example: “Coverage extended from 89% to 95% of titles, processing an additional 210K titles that adds $X to annual cost.”
4. Migration or Tech Debt Overlap. You’re running old and new systems in parallel during a transition. This is common and expected — but it needs a bounded timeline. Example: “A migration requires dual-pipeline operation through Q4 2020, temporarily increasing cost per unit by 1.5x. Cost converges after A/B validation.”
5. Forecast Update. Your original capacity plan was wrong or based on outdated assumptions. Correct the forecast and explain the revision.
6. System Inefficiency. Unplanned demand or suboptimal resource allocation. Example: “High usage of on-demand EC2 instances instead of reserved instances during traffic spikes.”
7. Other. Anything that doesn’t fit the above. Rare, but available.
The discipline isn’t bureaucratic — it’s clarifying. If your service’s cost per unit increased by 10 cents year-over-year, the bridge tells you exactly where each of those 10 cents went. That clarity is what lets you distinguish between investment (new features your customers need) and waste (architecture decisions that should be revisited).
In our organization, this bridge was reviewed weekly. The review surfaced a critical insight: roughly $1.2M/year in costs was attributable to the architectural limitation of copying full DynamoDB snapshots across regions rather than transferring incremental changes. That wasn’t a failure — it was a known tradeoff from the original architecture. But making it visible through the per-unit cost bridge created the business case for the an architecture that eventually replaced it.
Common Estimation Mistakes (And How to Avoid Them)
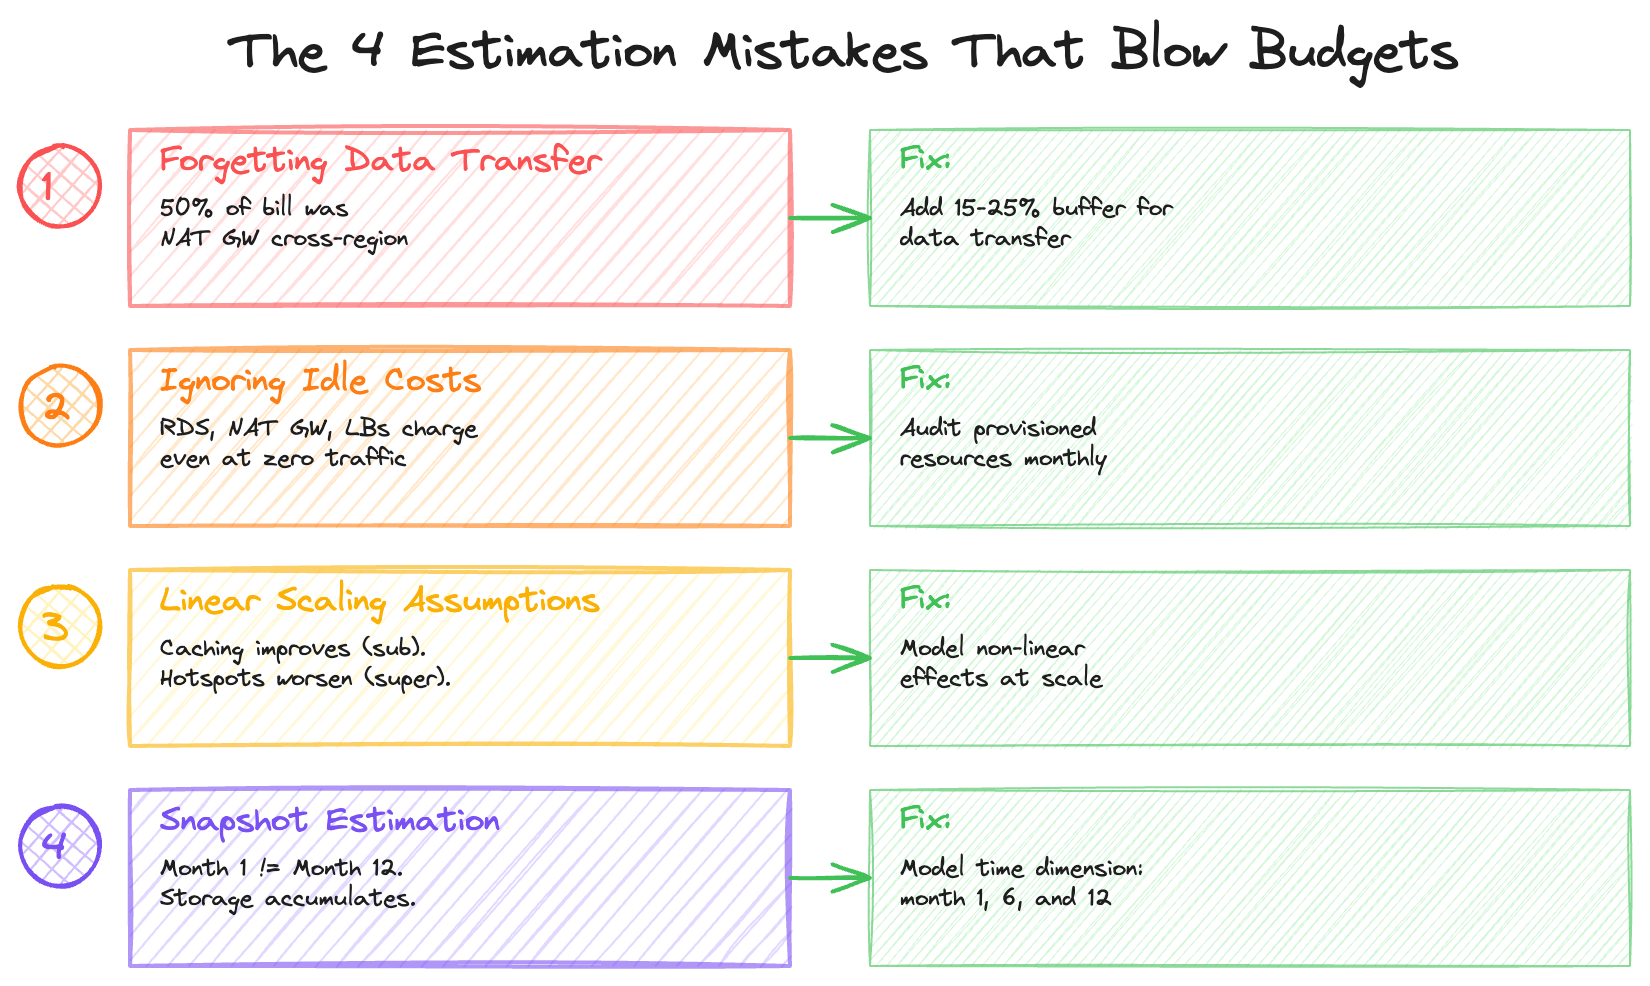
Mistake 1: Forgetting Data Transfer
Data transfer costs are the silent killer. They rarely surface in basic pricing calculators, yet they can dominate your bill. Watch closely for cross-region replication, NAT Gateway egress (especially in containerized workloads), API response payload sizes, and cross–availability zone traffic in multi-AZ deployments.
In one large-scale distributed system I analyzed, roughly 50% of a major infrastructure cost category — about $200K per month — turned out to be cross-region data transfer rather than compute. The architecture required copying full database snapshots across multiple regions for centralized processing, and the transfer costs far exceeded the transformation costs. A deeper breakdown showed that regional NAT Gateway egress alone accounted for over $100K per month. Similarly, the majority of the object storage bill was driven by cross-region transfer fees rather than storage capacity itself.
Rule of thumb: Add 15–25% to your estimate for data transfer if you haven’t explicitly calculated it.
Mistake 2: Ignoring Idle Costs
Some resources incur costs even when they’re barely used: managed databases, in-memory caches, load balancers, NAT gateways, and provisioned IOPS are all billed based on allocation rather than utilization. Whether traffic is at peak or trough, the meter keeps running.
In one system I reviewed, a distributed database layer accounted for roughly 12% of the monthly bill — about $48K — because it was running on provisioned capacity across three regions. Read capacity was reserved for a data processing pipeline, and write capacity supported upstream projections. The key issue: the bill remained constant regardless of actual workload. Utilization levels were significantly below the provisioned limits, meaning the system was paying for headroom it rarely consumed.
Switching to on-demand capacity — once the pipeline supported it — became an immediate cost-reduction lever. When workloads are variable or lower than expected, usage-based pricing can materially reduce spend without requiring architectural redesign.
Mistake 3: Linear Scaling Assumptions
Not all costs scale linearly.
Costs that scale sub-linearly (good): Caching (higher traffic = better hit rates) and reserved capacity (higher commitment = lower unit cost).
Costs that scale super-linearly (bad): Hotspots (traffic concentration increases costs disproportionately), rate limiting (hitting quotas triggers more expensive tiers), and retry storms (failures cascade, each retry consuming additional resources).
Mistake 4: Snapshot Estimation
Estimating based on current state ignores feature launches that increase per-request complexity, data accumulation over time, traffic seasonality (holiday spikes), and operational overhead (backups, DR, logging).
Build in a time dimension to your estimates. What does month 1 cost? Month 6? Month 12? As I covered in Part 3, the ratio between compute and storage shifts over time, and transitions like platform migrations can create temporary cost multipliers that need to be modeled explicitly.
The Cost Estimation Checklist
Before committing to a budget, verify you’ve accounted for everything.
Compute: Request processing (Lambda, containers, EC2), background jobs and cron, data processing pipelines, and retry/error handling overhead.
Storage: Primary data store, indexes and replicas, logs and metrics, backups and snapshots, and retention policies (defined, not “TBD”).
Data Transfer: Client responses (egress), cross-region traffic, cross-AZ traffic, NAT Gateway processing, and CDN origin fetches.
Supporting Services: Load balancers, API Gateway, message queues, caching layers, and monitoring/alerting.
Operational: Dev/staging environments, CI/CD costs, disaster recovery, and security/compliance tooling.
Growth Modeling: Per-unit cost calculated and baselined, business metric identified (titles, streams, orders, users), 12-month projection with three scenarios (low/base/high), and known cost-trajectory changes (launches, migrations, decommissions).
Accountability: Bridge categories defined for cost escalation explanations, monthly review cadence established, and alert and escalation thresholds set.
Building the Culture
The monitoring stack, bridge methodology, and checklist are tools. The real value comes from building a culture where cost is treated as a first-class design constraint — not an afterthought.
The way I think about it: frugality isn’t about minimizing spend. It’s about ensuring every dollar is intentional. A service that costs $400K/month and delivers $900M in business value is a great investment. A service that costs $400K/month where $200K is avoidable data transfer is an architecture problem.
The per-unit cost framework, combined with the bridge methodology, creates that distinction. It shifts the conversation from “why is your bill so high?” to “what’s driving each component of your per-unit cost, and is that the right tradeoff?” The first conversation is adversarial. The second is engineering.
Making this operational requires a few specific mechanisms. Design reviews should include cost projections — not as an afterthought, but as a section with the same weight as scalability and reliability. Monthly cost reviews should be driven by per-unit trends, not aggregate numbers. And when costs exceed projections, the bridge should be a standard operating procedure, not a fire drill.
What’s Coming in Part 5
The final installment brings everything together with three production case studies. I’ll show the full cost breakdowns, the optimization strategies, and the specific per-unit metrics that made it all measurable: Prime Video’s content distribution at $400K+/month (optimized to save $1.74M annually through two targeted architecture changes), a cart optimization system where $86/month in infrastructure drives $900M+ in business impact, and an ultra-fast delivery platform where cost per delivery dropped from $12.50 to $4.20 through density optimization.
Nikhil Chandra is an Engineering Manager with 11+ years of experience building high-scale e-commerce and streaming systems. He writes about engineering leadership and cloud architecture at codetofire.com. Connect on LinkedIn.
Tags: #cloud #aws #costoptimization #engineering #finops #systemdesign