

Chapter 2: Two Frameworks for Estimating Any Cloud Service Before You Build
Part 2 of 5: The Engineer's Guide to Service Cost Estimation

In Part 1, I introduced the Cost Per Unit mental model — the foundation of all cloud cost estimation. Now let’s put it to work with two practical frameworks: one for services you’re building from scratch, and one for services similar to something you already operate.
Framework 1: Bottom-Up Component Costing
This framework works best for new services where you’re designing the architecture. You walk through the request path, price every component, and multiply by expected traffic.
Step 1: List Every Billable Component
Draw your architecture diagram and identify every component that generates a bill:
Don’t forget the hidden costs that most teams miss: CloudWatch logs and metrics, load balancer hours, NAT Gateway data processing, cross-AZ data transfer, backup storage, and KMS key operations.
This is where most cost estimates fail — not on the components engineers think about, but on the ones they forget. When I designed the Progressive Cart Incentive Platform (a system that dynamically adjusts free-shipping thresholds based on real-time cart contents), the initial estimate accounted for Lambda, DynamoDB, and API Gateway. It missed CloudWatch log ingestion costs, which for a service processing millions of cart events would have been significant at scale. Catching that early let us implement log sampling before launch rather than scrambling to add it after the first bill.
Step 2: Estimate Per-Request Cost
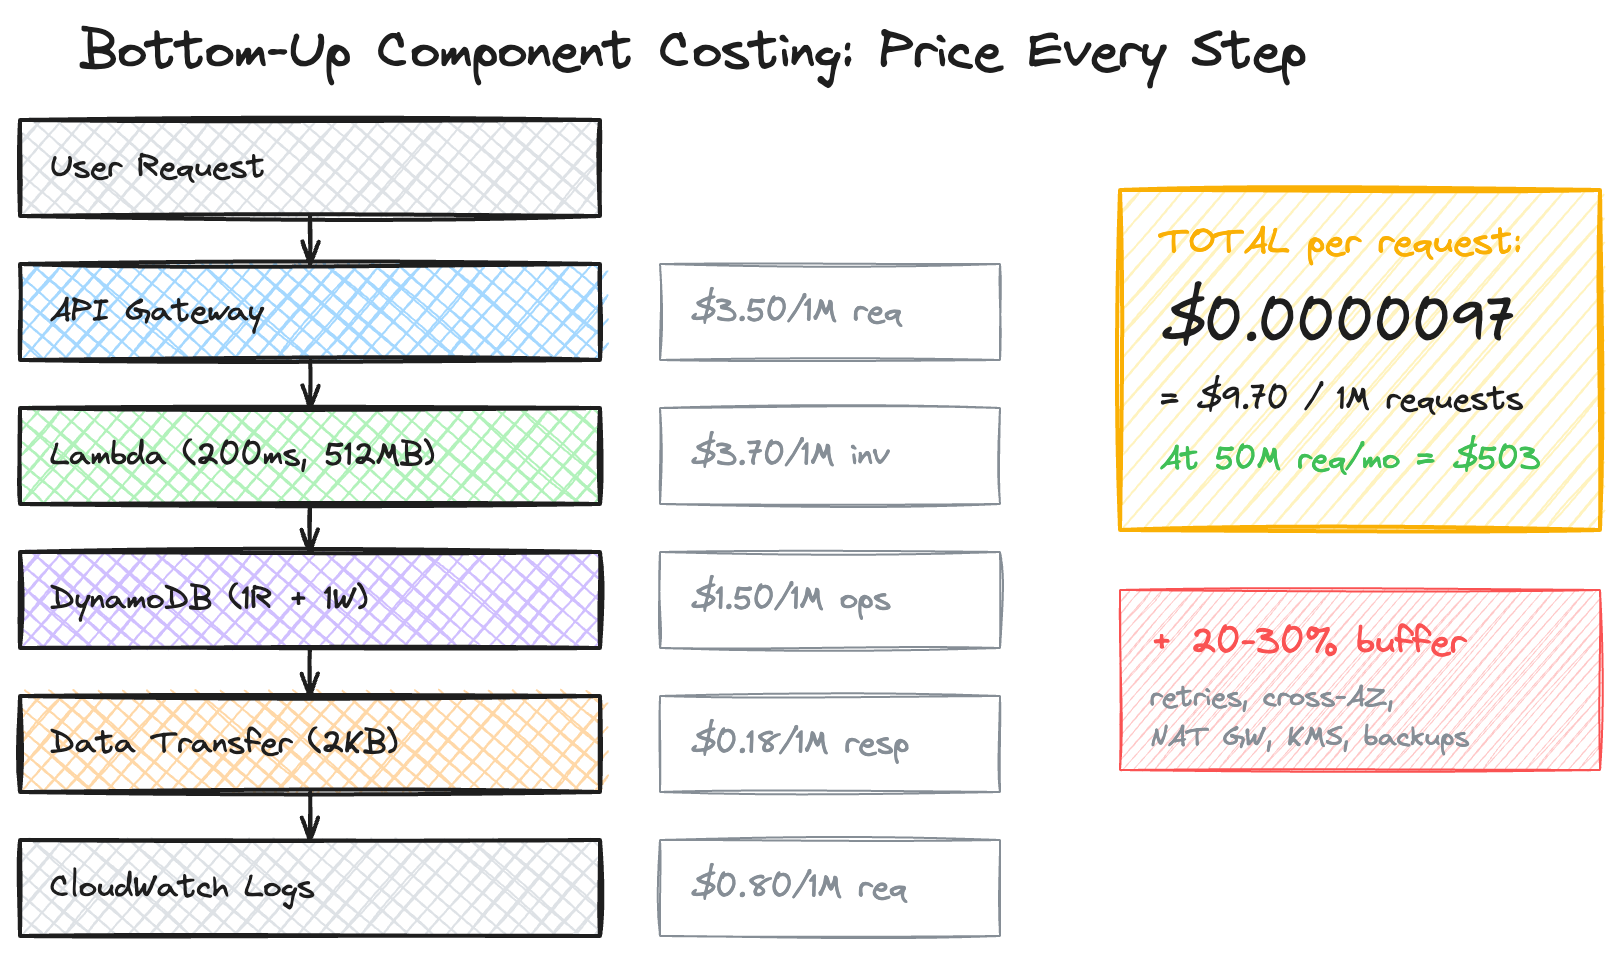
For a single request flowing through your system, calculate the cost of every component it touches.
Example: Simple API Service
Cost Per 1M Requests: ~$9.70
Step 3: Add Storage Baseline
Step 4: Multiply by Expected Traffic
Now apply your traffic estimate:
Traffic: 50M requests/month
Compute costs: 50 × $9.70 = $485
Storage costs: $18 (fixed)
Total: ~$503/month
Add a 20–30% buffer for unknowns: ~$600–650/month
This buffer isn’t padding — it’s accounting for the cross-AZ transfers, retry overhead, and operational costs that are genuinely hard to predict before launch.
Framework 2: Analogous Service Benchmarking
This framework works best when you’re adding features to existing services or building something similar to what you’ve built before. It’s faster than bottom-up, though less precise.
Step 1: Find Your Analog
Identify a similar service you already operate. Match on traffic pattern (API, batch, streaming), data model (transactional, analytical, time-series), and scale (order of magnitude).
Step 2: Calculate the Analog’s Cost Per Unit
Pull the actual costs from your billing:
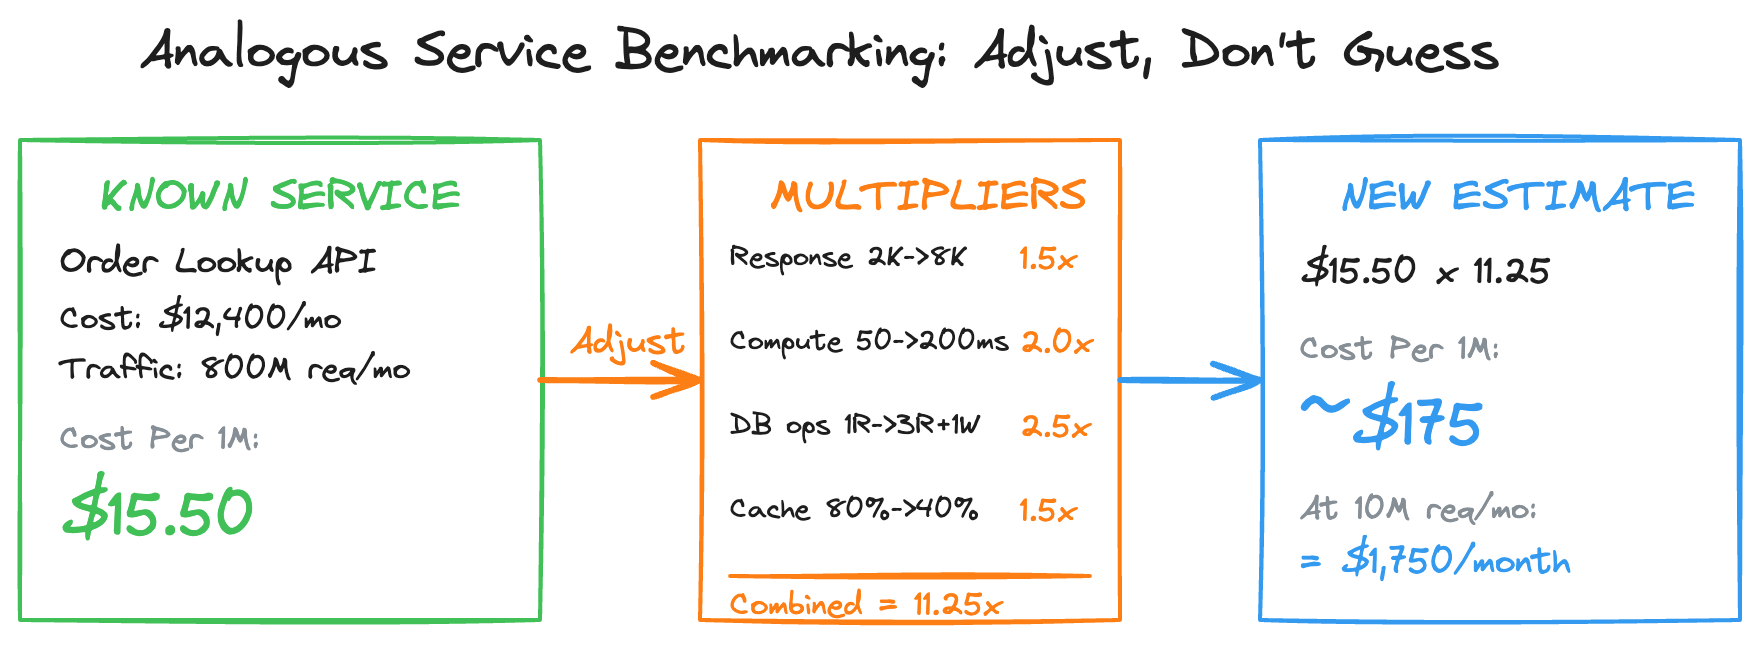
Service: Order Lookup API
Monthly cost: $12,400
Monthly requests: 800M
Cost Per 1M Requests: $15.50
Step 3: Adjust for Differences
This is where the framework earns its keep. Identify what’s different about your new service and assign multipliers:
Combined multiplier: 1.5 × 2 × 2.5 × 1.5 = 11.25x
Step 4: Calculate Estimate
When to Use Which Framework
Bottom-up when you’re building something genuinely new, when precision matters for budget approval, or when the architecture is well-defined. It takes more time but gives you component-level visibility into where costs will concentrate.
Analogous when you need a quick estimate for planning, when you’re extending an existing system, or when the architecture is still fluid. It’s faster and good enough for directional decisions.
In practice, I use both — analog for the initial proposal, bottom-up to validate before committing budget. When we designed the notification-based catalog feed architecture to replace Prime Video’s batch feed generation system, I used the existing batch system ($400K/month) as the analog, then did bottom-up costing on the new event-driven design. The analog told me the order of magnitude; the bottom-up analysis showed me that by switching from full-snapshot cross-region copies to incremental event propagation, we could eliminate the dominant cost driver entirely.
The Hidden Cost That Breaks Both Frameworks
Both frameworks require you to be honest about hidden costs — and the one that catches the most teams is data transfer.
Here’s a concrete example. A digital streaming service’s catalog content generation system operated across three AWS cloud regions. The architecture worked like this: the catalog data store maintained distributed database projections in multiple regions. Processing jobs in each region (IAD/DUB/PDX) read from the local database, transformed the data, and wrote consolidated snapshots to centralized object storage in a single region (IAD). From there, structured feeds were generated and distributed to downstream distribution partners and platforms.
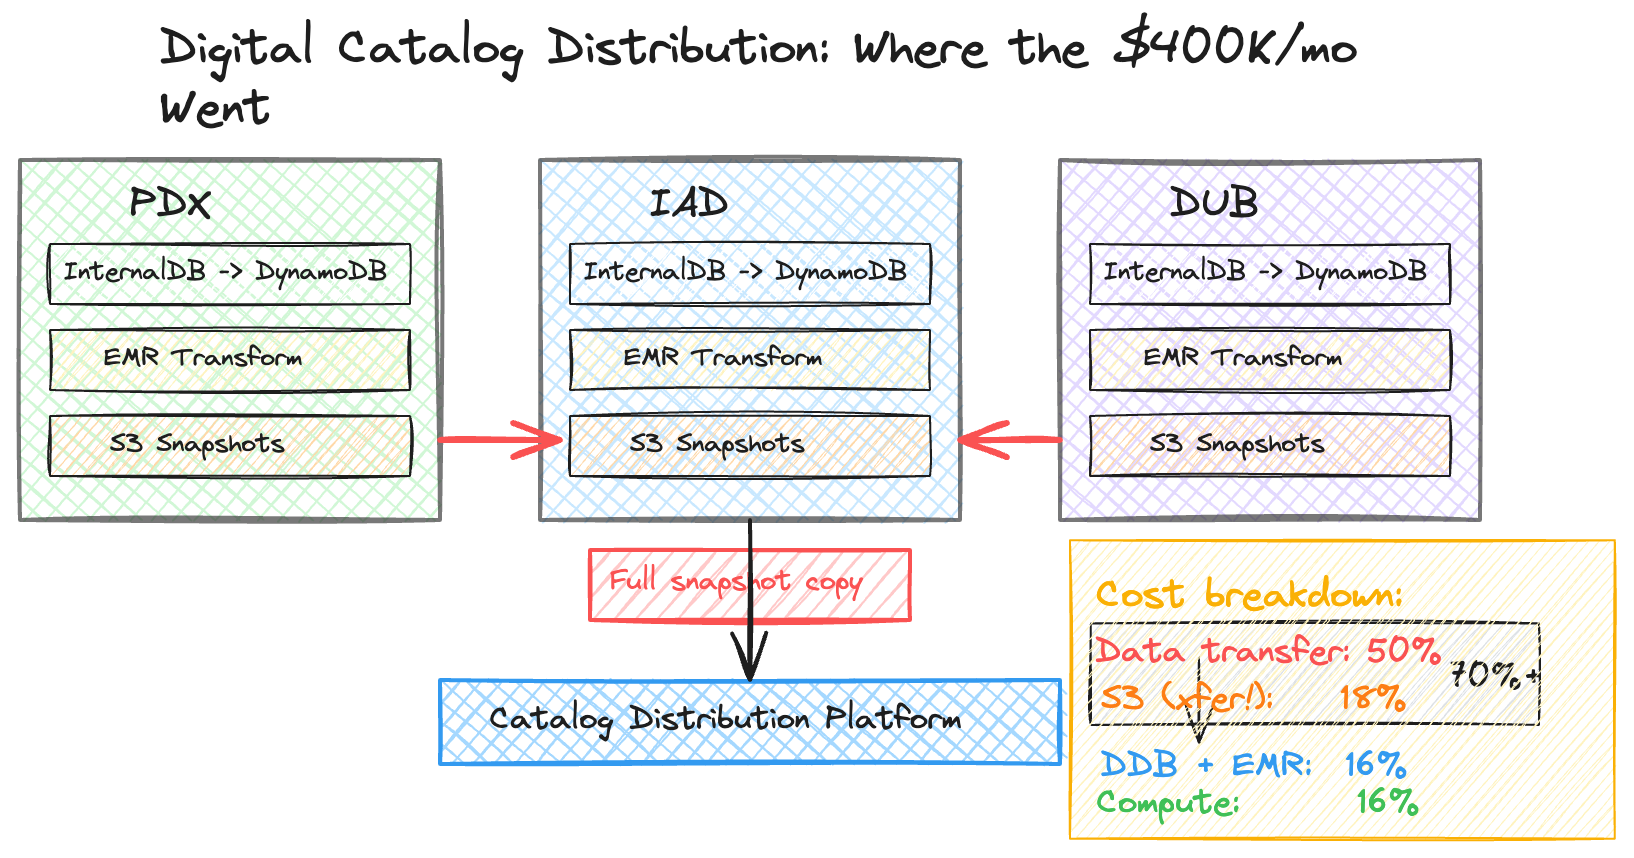
The monthly bill was approximately $400K. Here’s where the money actually went:
The “EC2-Other” category — which most people assume is compute-related — was dominated by NAT Gateway data transfer across regions. When I broke it down by usage type, EU-NatGateway-Bytes alone was ~$117K/month and USW2-NatGateway-Bytes was ~$68K/month. Actual EBS IOPS costs were under $1K.
Similarly, 75% of the S3 bill wasn’t storage — it was cross-region transfer fees from moving data between USE1, EU, and USW2.
The lesson: always decompose your cost categories beyond what the billing dashboard shows you. The label on the bill rarely tells the full story. I’ll walk through the complete optimization in Part 5, but the preview is this: two targeted architectural changes addressing data transfer and storage duplication reduced SCCPS from $0.024 to $0.010 per 1K streams — a 60% reduction equaling $1.74M in annual savings.
What’s Next
In Part 3, I’ll cover two frameworks that address the other half of the estimation challenge — modeling how costs grow over time through storage accumulation and traffic forecasting. If you’ve ever launched a service with a clean estimate that degraded over six months, that’s the part for you.
Tags: #cloud #aws #costoptimization #engineering #finops #systemdesign
Nikhil Chandra is an engineering leader with over 11 years of experience building and operating high-scale e-commerce and digital streaming platforms at FAANG companies. Proven track record of building high-performing teams, architecting platforms generating $1B+ in business impact, and delivering innovations adopted industry-wide. Nikhil writes about intersection of software engineering, career growth, and long-term wealth creation at codetofire.com