

Chapter 1: Why Engineers Struggle To Estimate Cloud Costs (And the Mental Model That Fixes It)
Part 1 of 5: The Engineer’s Guide to Service Cost Estimation.

“How much will this cost to run?”
It’s the question every engineer dreads and every finance partner asks. And most of the time, we guess. We look at similar services, add a buffer, and hope we’re in the ballpark.
Then the bill arrives, and we’re either 3x over budget or sitting on provisioned capacity we’re not using. Both are failures — one costs money directly, the other costs credibility.
Over the past eleven years, I’ve built and operated services where getting cost estimation wrong had real consequences — a content streaming platform serving 200+ countries where a single architecture decision moved the monthly bill by six figures, and e-commerce systems where the infrastructure cost was trivial but understanding the unit economics unlocked $900M+ in business value. Through that work, I’ve developed mental models for cost estimation that consistently land within 15–20% of actual spend.
This is Part 1 of a 5-part series where I’ll share the frameworks, walk through real production cost breakdowns, and show you where the money actually goes (spoiler: it’s rarely where you think).
The Two Fundamental Cost Drivers
Before diving into frameworks, you need to understand the two fundamental ways cloud services charge you.
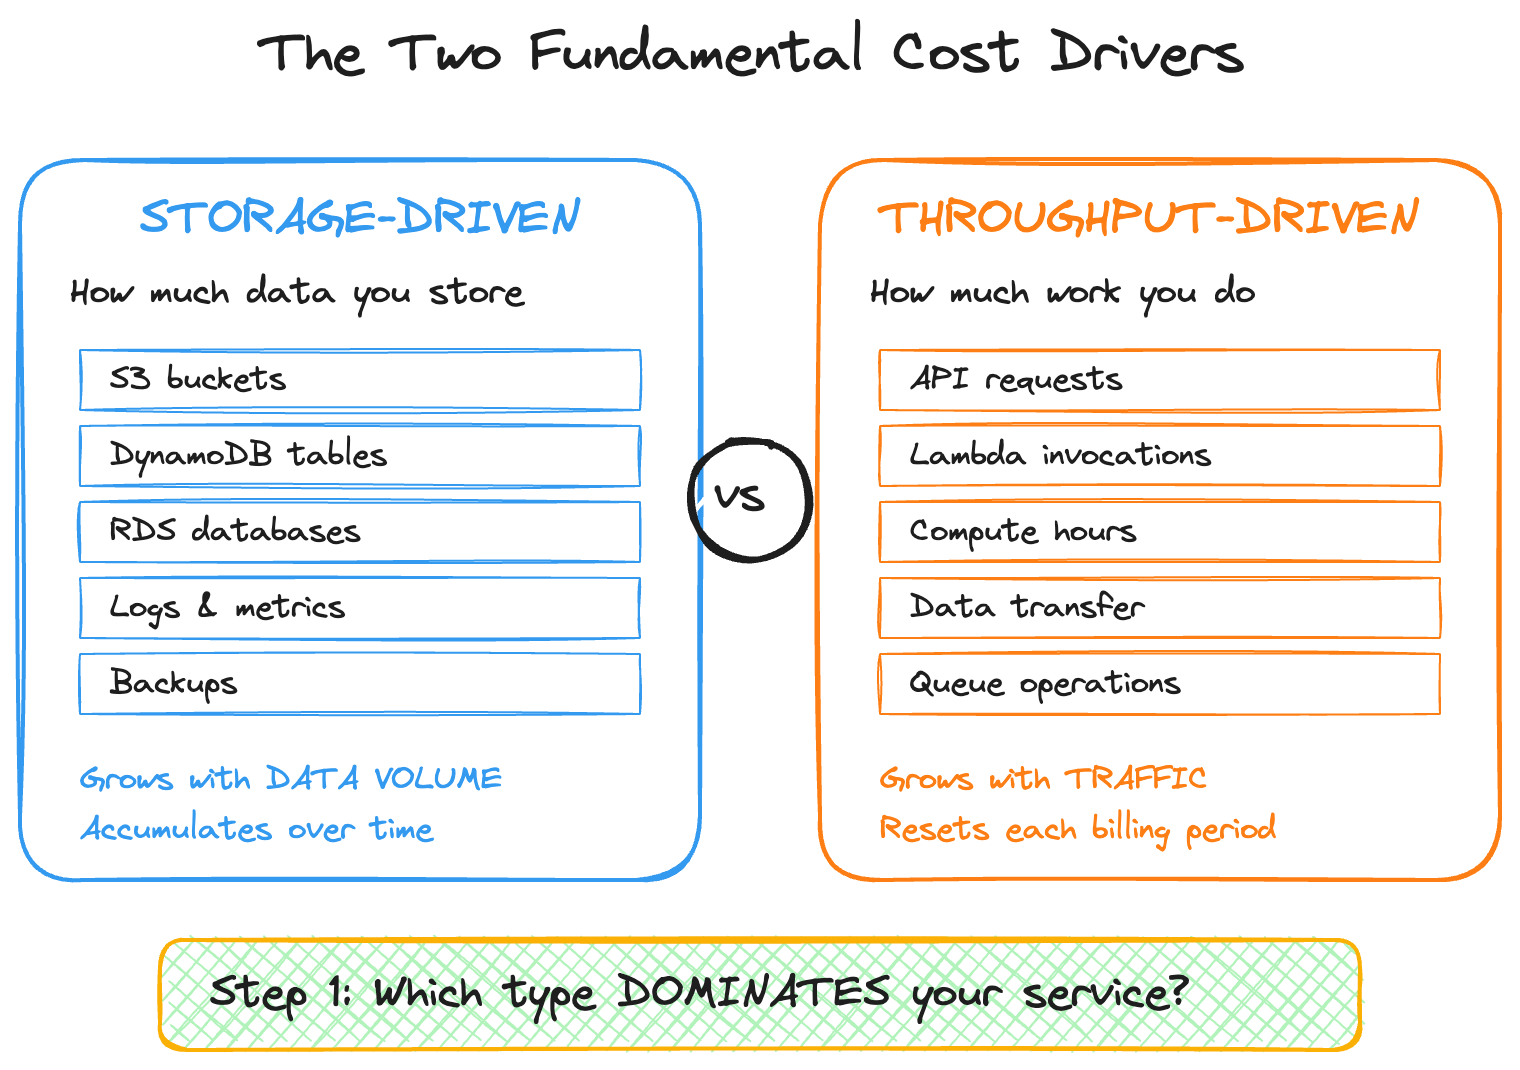
1. Storage-Driven Costs
You pay for how much data you store, regardless of how often you access it. This includes S3 storage, database storage (RDS, DynamoDB), data warehouse storage, logs and metrics retention, and backup and snapshot storage.
Storage-driven costs grow with data volume. They’re generally linear. And critically, they accumulate over time unless you actively delete data.
The key question is: “How much data will we store, and for how long?”
2. Throughput-Driven Costs (TPS/Compute)
You pay for how much work your service does — requests processed, compute consumed, data transferred. This covers API Gateway requests, Lambda invocations, EC2/container compute hours, database read/write operations, data transfer (egress), and message queue operations.
Throughput-driven costs grow with traffic. They can be spiky. And they reset each billing period.
The key question is: “How many requests will we handle, and how much compute does each request need?”
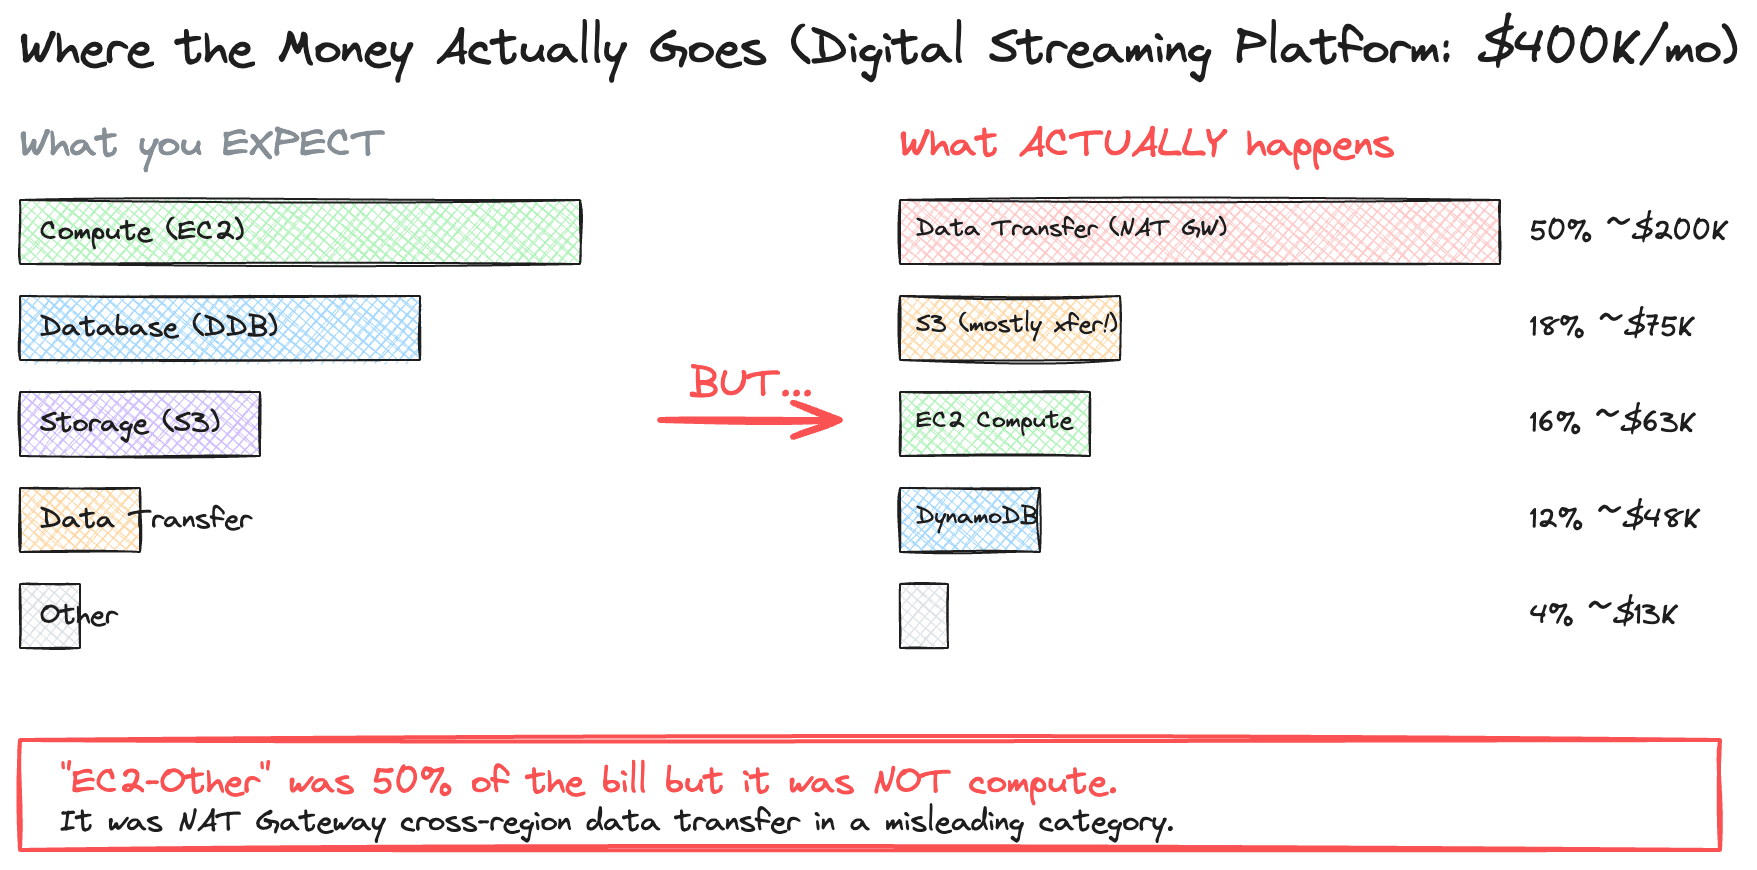
Understanding which cost component dominates your service is the first step to accurate estimation. Most engineers default to thinking about compute. Back in 2022 when I decomposed the monthly bill for a large-scale, multi-region content aggregation pipeline — one that pulled metadata from distributed databases across multiple regions, ran large-scale transformation jobs, and distributed structured feeds to downstream partners — cross-region data transfer accounted for 50% of the $400K monthly spend, while actual compute was only 16%. That mismatch between assumption and reality is exactly what a good mental model helps prevent.
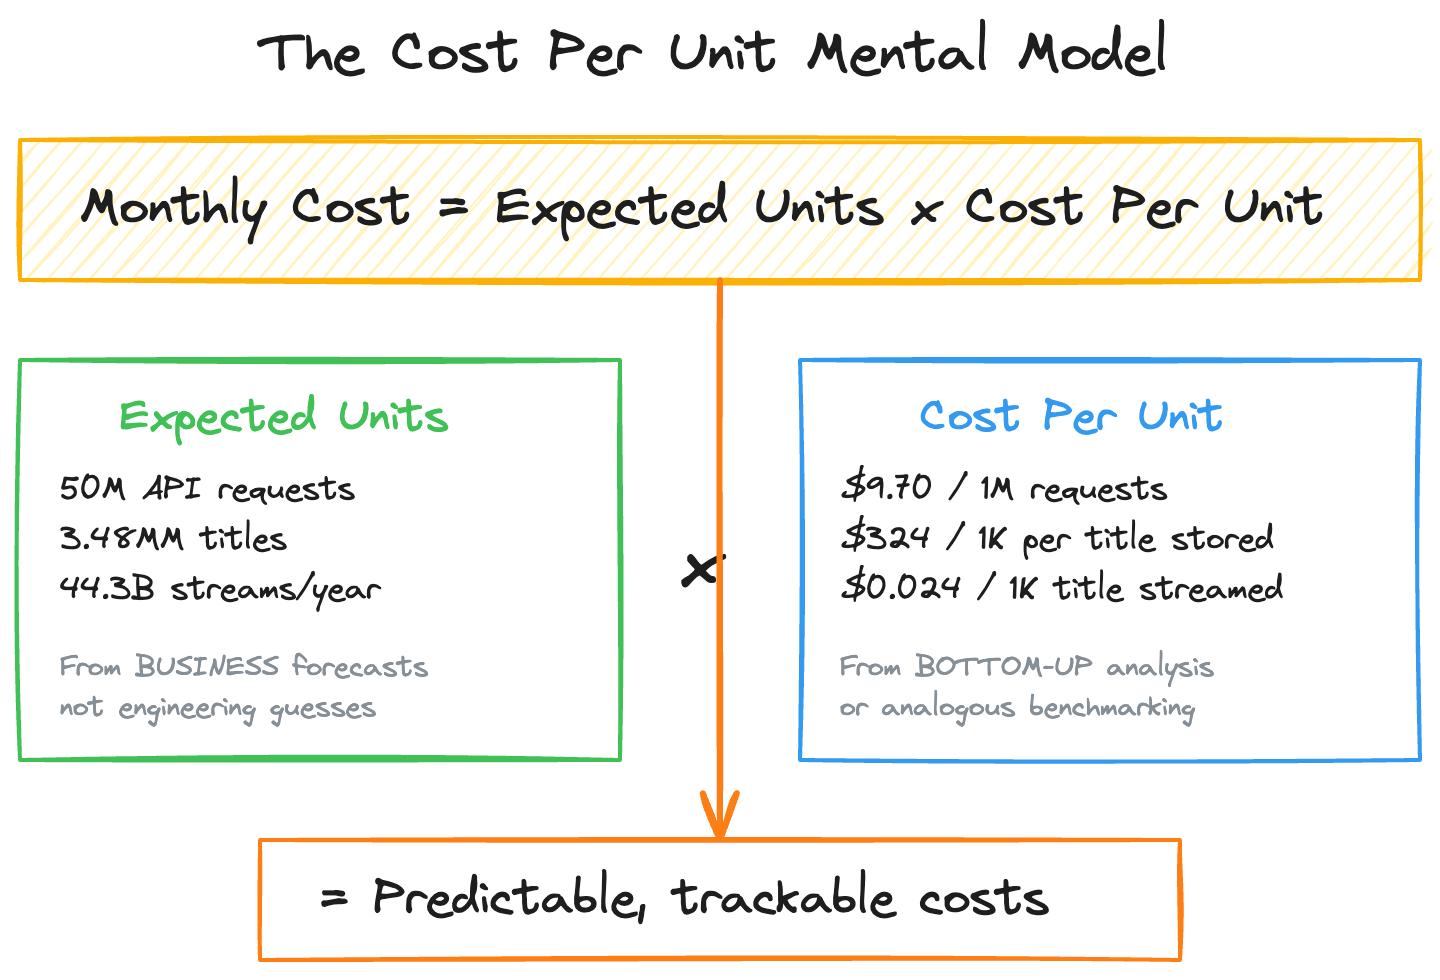
The Mental Model: Cost Per Unit
The single most important mental model for cost estimation is Cost Per Unit (CPU) — and I don’t mean the processor.
Every service can be expressed as a cost per meaningful unit of work:
Once you have Cost Per Unit, estimation becomes multiplication:
Monthly Cost = (Expected Units) × (Cost Per Unit)The hard part isn’t the math. It’s accurately calculating Cost Per Unit for complex services and accurately forecasting Expected Units.
Example: Applying Cost Per Unit to a Streaming Platform
To make this concrete, consider a digital streaming platform. The compute unit can be thought of as a title (a movie, series, or episode) being processed or delivered. A stream is analogous to a customer watching that title, which drives throughput costs like CDN delivery and request processing. Meanwhile, storage costs come from storing video, audio, subtitles, and metadata assets required to make that content available globally. As the catalog grows, storage costs grow; as viewing traffic grows, throughput costs scale. Separating these two behaviors makes it much easier to predict and optimize total platform spend.
Why Per-Unit Thinking Changes Everything
Looking at macro-level budgets tells you very little. If your annual bill went from $2M to $3.2M, is that a problem? It depends entirely on what the business did.
This distinction became central to how a large-scale video processing and distribution platform approached cost accountability. We tracked two flavors of per-unit cost: one metric for fleets that scaled with catalog size, and another for fleets that scaled with viewing traffic. With millions of titles and tens of billions of streams, these metrics gave every team — from catalog ingestion to video encoding to partner delivery — a common language for cost conversations.
The power of per-unit metrics showed up immediately. The overall platform budget was growing over 60% year-over-year. At the macro level, that’s alarming. But catalog size was growing only about 16%. Per-unit analysis revealed exactly where the gap originated: new services being onboarded, migration periods running parallel infrastructure, and architecture decisions that hadn’t yet been optimized for the new scale. Without per-unit decomposition, those conversations would have been vague assertions. With it, every team could point to specific cost drivers and concrete reasons.
I helped establish and operationalize this cost-per-unit framework across multiple teams working on catalog and content discovery systems. The methodology — decomposing spend by infrastructure component, mapping each cost to a business-meaningful unit, and tracking per-unit trends monthly — is something I now apply to every system I build. It forms the foundation for everything else in this series.
What’s Coming in This Series
Over the next four parts, I’ll walk through five battle-tested frameworks for cloud cost estimation:
Part 2 covers two estimation frameworks — Bottom-Up Component Costing for new services, and Analogous Service Benchmarking for features added to existing systems. I’ll show how both methods work with real numbers and where each one breaks down.
Part 3 tackles the two areas that catch most teams off guard: Storage Growth Modeling (why a single retention policy decision can be a 12x cost difference) and Traffic Forecasting tied to business drivers rather than guesswork.
Part 4 is the operational playbook — daily cost monitoring, Cost Per Unit trending, component breakdowns, and the most common estimation mistakes I’ve seen across dozens of services.
Part 5 brings it all together with three production case studies: a content streaming platform (Think Netflix / Prime Video) where two targeted optimizations saved $1.74M annually, a real-time e-commerce system that costs $86/month and drives $900M+ in business impact, and an ultra-fast delivery system where cost per delivery dropped 66% through density optimization.
Each part includes concrete numbers, actual cost breakdowns, and practical takeaways you can apply to your own systems.
See you in Part 2.
Tags: #cloud #aws #costoptimization #engineering #finops #systemdesign
Nikhil Chandra is an engineering leader with over 11 years of experience building and operating high-scale e-commerce and digital streaming platforms at FAANG companies. Proven track record of building high-performing teams, architecting platforms generating $1B+ in business impact, and delivering innovations adopted industry-wide. Nikhil writes about intersection of software engineering, career growth, and long-term wealth creation at codetofire.com